

- The Bitcoin crypto price volatility is medium, resulting in 2.33%.
- The average fee per user of Bitcoin has advanced by 220% in the last 30 days.
The first decentralized cryptocurrency, Bitcoin, operates without a central authority and uses blockchain technology for secure, pseudonymous transactions.
Miners validate transactions by solving complex problems and earning rewards. Bitcoin’s supply is capped at 21 million, with controlled inflation. It offers peer-to-peer payments, a store of value, and global accessibility.


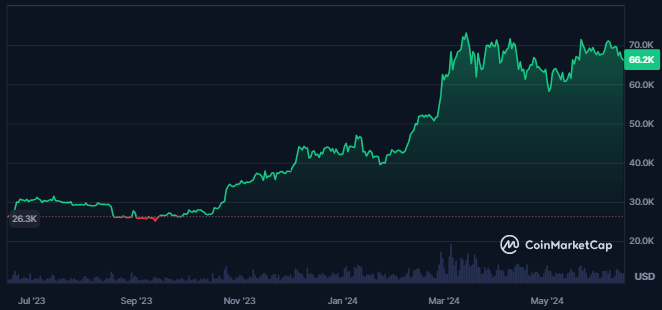
Price Overview Chart of BTC | Source: CoinMarketCap
In the last year, Bitcoin crypto has given its investors huge returns of 165%. Also, the market cap value of the crypto is $1.306T, which is 51% of the crypto’s overall market cap.
A popular indicator from the public script of Tradingview known as BBWP, often used for volatility measurement, has formed four bars on the weekly chart. This shows a considerable probability of volatility in Bitcoin price.
The same indicator is mentioned in an X post by @el_crypto_prof.
#Bitcoin
— 𝕄𝕠𝕦𝕤𝕥𝕒𝕔ⓗ𝕖 🧲 (@el_crypto_prof) June 12, 2024
This is the first time in $BTC's history that the BBWP indicator shows 4 blue bars (weekly chart).
We're talking about a volatility indicator here, which means: The more bars, the more volatility we can expect.
Above the EMA 20-Line it has always been bullish so far. pic.twitter.com/jbEPgYa0PK
The Bitcoin crypto has given multifold returns to its investors since its launch around 14 years ago. It further has a maximum supply of 21.0M BTC, and at press time, 19.712M BTC is circulating in the market.
Over the last 24 hours, Bitcoin has been silently moving without any significant change in its market cap and trading volume. Also, the crypto’s volume/market cap ratio is 2.04%, which shows good liquidity in the crypto price.
As per the analysts, the crypto sentiment is bearish at press time, and crypto supply inflation is 1.58%, which is considered good for crypto performance.
Also, the top 10 holders of Bitcoin have 5.32% of the circulating supply and have a total of 54.65K holders. The total value locked for the crypto has further witnessed a strong surge over the last few days, resulting in $1.102B.
What Do Bitcoin Derivatives Say About Crypto?
The derivatives trading volume of the Bitcoin crypto has been trading flat over the last 24 hours since press time. The open interest in crypto has also witnessed a slight decline of 0.36%.
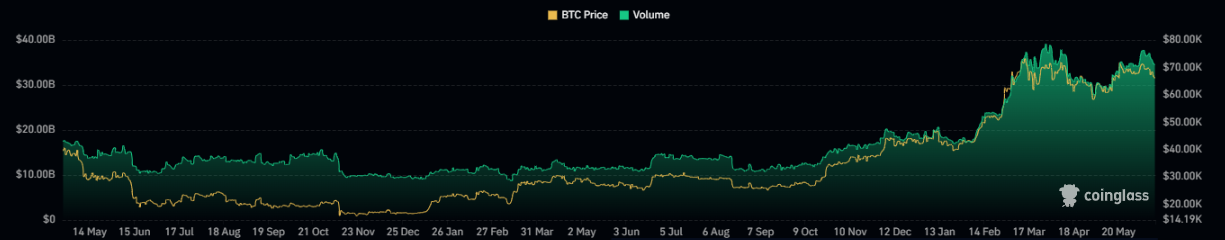
Bitcoin Crypto Derivatives Volume Chart | Source: Coinglass
The derivatives trading volume of the crypto is at a surge, showing advance on the charts followed by the last few days.
Also, the long/short ratio of the crypto is 0.9524, and the recorded long liquidation for the crypto is much higher, resulting in $43.51M. Additionally, the short liquidation for the crypto is worth $8.45M.
BTC Crypto Technical Analysis
The BTC crypto price recently broke below crucial support levels, forming a rising wedge pattern. After a period of consistent gains reaching certain highs, the price began to consolidate at elevated levels, creating a dynamic range that resulted in this pattern.
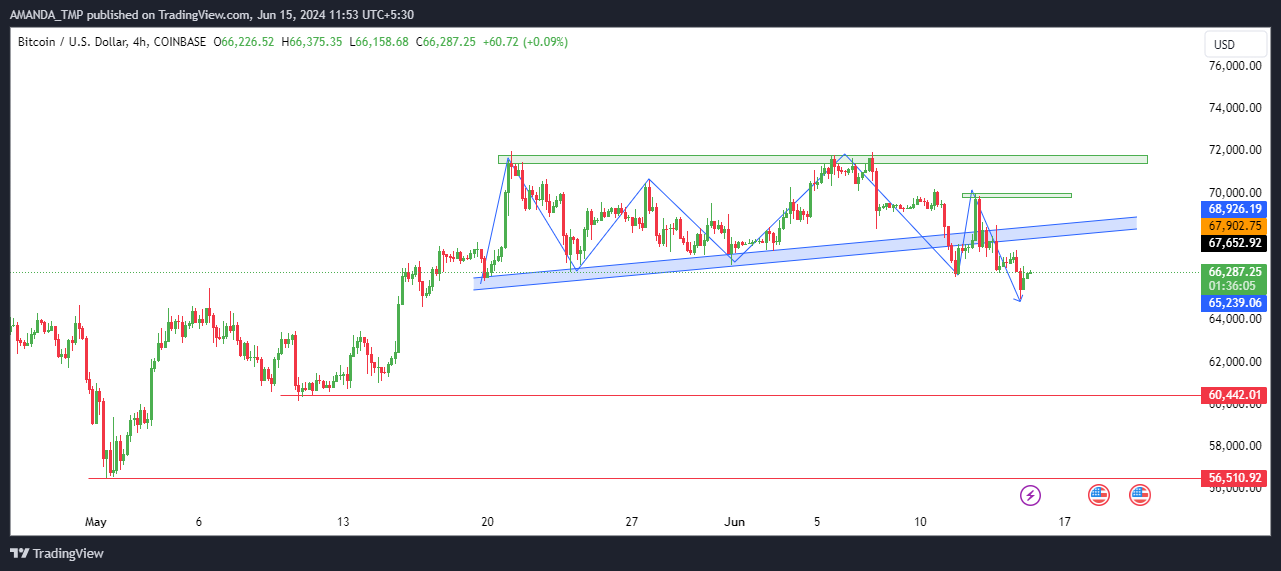
BTC Crypto 4H Price Chart | Source: TradingView
The latest price action indicates a significant breakdown below the rising wedge. This breakdown was marked by a series of strong bearish candles, signaling a shift in market sentiment. Additionally, the chart shows a lower low swing, reinforcing the bearish outlook.
Given the current chart behavior, there is a heightened probability that the BTC price will decline further. This recent trend suggests that investors should be prepared for potential drops to even lower levels shortly.
BTC/USD Chart by TradingView.com
The 50-day and 200-day EMAs on the 4-hour chart are trading in a golden crossover. Despite this bullish signal, BTC’s price has broken below the 200-day EMA, indicating a significant loss of bullish momentum.
Further reinforcing the bearish outlook, the MACD indicator has issued a fresh sell signal. This is accompanied by a bearish crossover between the MACD and the signal line, trading in a negative trajectory.
Additionally, the RSI reflects a decline in bullish momentum and an increase in bearish pressure, currently standing at 41.44. This level indicates oversold conditions and is further confirmed by the RSI breaking below the 14-day SMA.
Summary
BTC’s price broke below key support levels, forming a rising wedge pattern and signaling a bearish trend.
Indicators such as MACD and RSI confirm declining bullish momentum and increased bearish pressure. Despite a golden crossover, the price below the 200-day EMA suggests further declines are likely.
The support levels for the BTC crypto on the lower side are $56,510 and $60,500, followed by the resistance levels of $70,000 and $72,000.
Disclaimer
This article is for informational purposes only and does not provide any financial, investment, or other advice. The author or any people mentioned in this article are not responsible for any financial loss that may occur from investing in or trading. Please do your research before making any financial decisions.


