
- Massive long liquidation is recorded in Quant Crypto.
- The price of the QNT crypto is down by 81% from its all-time high price.
Quant, launched in June 2018, aims to connect global blockchains via its Overledger Network, enabling multi-chain dApps (MApps).
Using a hybrid PoS/PoA consensus ensures interoperability and security. The native QNT token powers the network, enabling governance, fee payments, and developer access. Founders include Gilbert Verdian and Dr. Paolo Tasca.


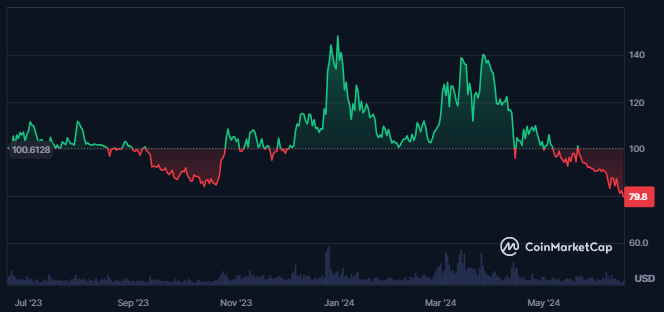
The market cap of Quant crypto has witnessed a decline of 3.8% in the last 24 hours and has been consistently declining over the previous few days. Furthermore, the crypto’s market cap ranking is #74, as per CoinMarketCap.
The trading volume of the crypto further witnessed an advance of 39%, leading to a traded value of $11.832M in the last 24 hours. That resulted in low liquidity as only 1.21% of the crypto market cap is traded.
The circulating supply of the crypto at press time is 81% of the maximum supply, resulting in 12.072M QNT. Also, the maximum supply of crypto is 14.881M, resulting in a fully diluted market cap of $1.189B.
What Do Derivatives Indicate About the Quant Crypto?
The derivatives volume for the Quant advanced by 46% in the last 24 hours, resulting in a traded value of $10.24M.
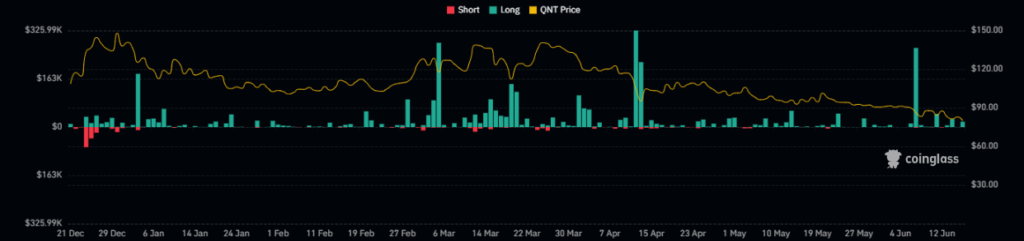
The liquidation chart of the crypto further shows huge, consistent longs being liquidated in the crypto over the last few days.
Additionally, in the last 24 hours, the liquidated longs for the crypto are worth $19.01K while the short liquidation for the crypto values nill.
QNT Crypto Technical Analysis
The QNT crypto price has recently reached crucial support levels following a significant breakdown. The daily chart indicates a strong downtrend, marked by the formation of a lower low swing structure.
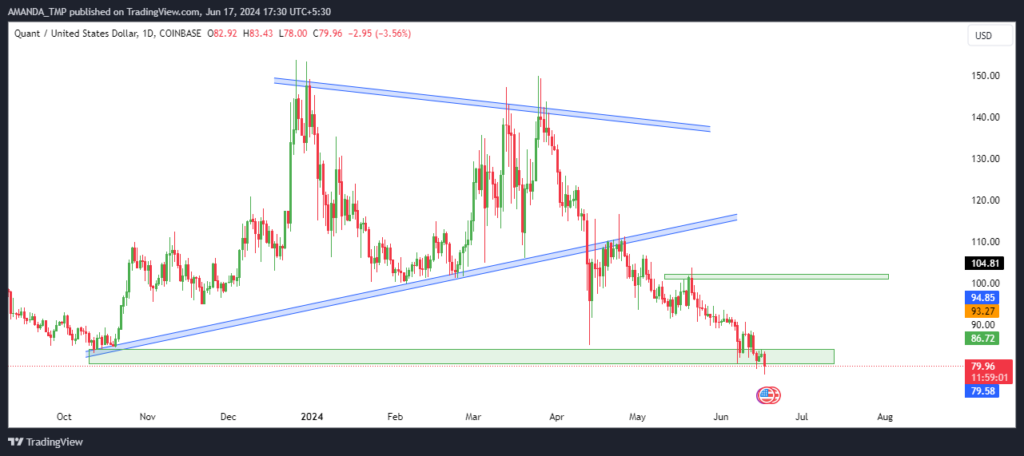
Examining the overall price action reveals that the QNT crypto trading price fell below a symmetric triangle pattern, leading to notable profit booking. Since this breakdown, QNT has declined by 25%, though it is currently trading at a strong support level.
Any bullish price action from the current levels might change the crypto price trend if the previous swing high is taken out.
QNT/USD Chart by TradingView
The daily chart of the QNT crypto shows the 50-day and 200-day EMAs forming a death cross, signaling a solid downtrend. QNT crypto price has been trading below these EMAs for an extended period, reinforcing the bearish sentiment.
Additionally, the MACD and signal line are positioned below the median level and overlapped, indicating heightened volatility and weakness in the cryptocurrency. This overlap suggests uncertainty in the market direction.
Moreover, the RSI has remained below the 50 level, following a bearish cycle. It indicates declining momentum in the crypto price, further supporting the downtrend observed in the technical indicators.
Summary
Quant (QNT) crypto has declined by 81% from its all-time high and recently broke below a symmetric triangle, leading to significant profit booking.
The price remains in a strong downtrend, with EMAs forming a death cross, bearish MACD, and RSI below 50, indicating continued weakness and declining momentum.
The price of the QNT crypto might take support at the levels of $65.0 and 70.0, followed by the resistance levels of $103.0 and $116.0.
Disclaimer
This article is for informational purposes only and does not provide any financial, investment, or other advice. The author or any people mentioned in this article are not responsible for any financial loss that may occur from investing in or trading. Please do your research before making any financial decisions.


