
- The Bitcoin price has advanced by 148% in the previous one year.
- BTC crypto has high liquidity based on its market cap.
Bitcoin (BTC), the first successful decentralized cryptocurrency, uses peer-to-peer technology and blockchain to ensure secure, censorship-resistant transactions.
Miners validate transactions and are rewarded with BTC. Bitcoin’s supply is capped at 21 million, with a block added every 10 minutes. Created by Satoshi Nakamoto in 2009, Bitcoin serves as both a payment method and a store of value.


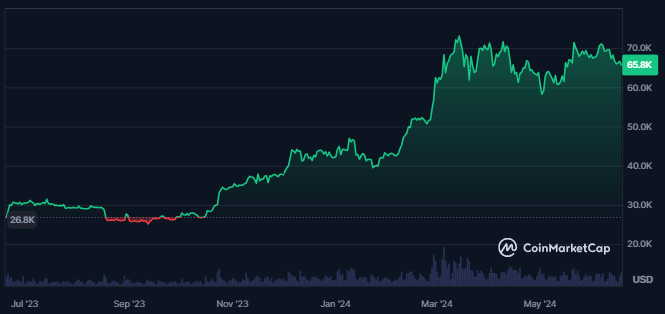
The Bitcoin crypto price volatility is very low at 1.94%, which shows stability in its price. Its market cap dominance is 54.5%, making it the largest cryptocurrency in the global crypto market.
The Bitcoin market cap has been trading flat over the last 24 hours, while the value of the crypto traded volume has advanced by 105%, resulting in a traded value of $36.480B. The following data is followed by a volume/market cap ratio of 2.82%.
Bitcoin Crypto Derivatives Analysis
Despite declining options volume, the derivatives crypto volume witnessed a surge of 190% in the last 24 hours.
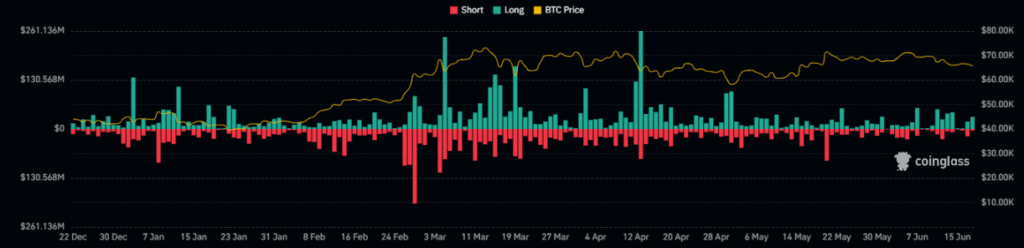
The open interest of Bitcoin has been flat over the last 24 hours, following which the options volume has declined by 39.7%, resulting in a value of $625.97M.
The recorded long liquidation for the crypto further is worth $47.63M against the short liquidation of $22.76M. It represents the dominance of sellers in the crypto price.
BTC Crypto Technical Analysis
The BTC price recently broke below crucial support levels, forming a rising wedge pattern. After consistent gains and reaching certain highs, the price consolidated at elevated levels, creating this pattern.
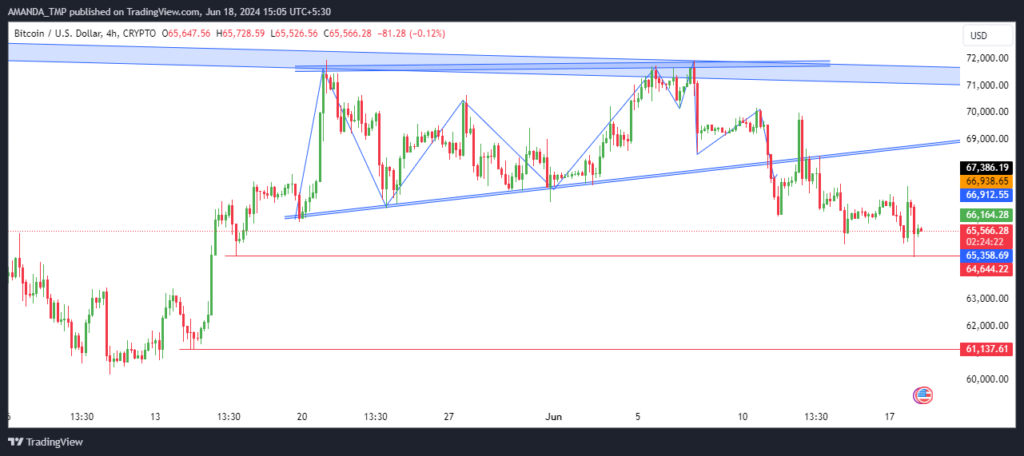
The latest price action indicates a significant breakdown below the rising wedge, marked by a series of strong bearish candles and a lower low swing, signaling a shift in market sentiment.
Given that behavior, there is a heightened probability that the Bitcoin price will decline further, suggesting that investors should prepare for potential drops to even lower levels shortly.
BTC/USD Chart by TradingView
The 50-day and 200-day EMAs on the 4-hour BTC chart are trading in a golden crossover, typically a bullish signal. However, BTC’s price has dropped below the 200-day EMA, indicating a significant loss of bullish momentum.
Reinforcing the bearish outlook, the MACD indicator has issued a fresh sell signal, with a bearish crossover between the MACD and the signal line, both trading negatively.
Additionally, the RSI reflects declining bullish momentum and increasing bearish pressure, currently at 41.44. This indicates oversold conditions, confirmed by the RSI breaking below the 14-day SMA.
Summary
Bitcoin’s recent price action shows a breakdown below crucial support levels, forming a bearish rising wedge pattern.
Despite a bullish golden crossover of the 50-day and 200-day EMAs, BTC has lost momentum, falling below the 200-day EMA. Indicators like the MACD and RSI also signal a bearish trend, suggesting potential further declines, although market conditions remain uncertain.
If the price of the BTC crypto continues to decline, it might take support at the levels of $61,100 and $64,600, followed by the resistance levels of $69,700 and $71,800.
Disclaimer
This article is for informational purposes only and does not provide any financial, investment, or other advice. The author or any people mentioned in this article are not responsible for any financial loss that may occur from investing in or trading. Please do your research before making any financial decisions.


