
- The CORE price has formed a significant bullish candlestick pattern at the support level.
- Trading volume has increased by 51% in the past 24 hours.
Since April, the Core price has declined by 67% and showed weakness in the broader time frame. In April, the CORE crypto price attempted thrice to overcome the $2.75 hurdle but failed. Since then, the price has declined and has not reached the last swing high.
For the past few weeks, the Core crypto price has remained below the 20-day EMA and has slipped below the 200-day EMA. However, it bounced back immediately and reached near the 200-day EMA.


According to the technical indicators, the RSI has recovered from the oversold zone and is yet to advance the RSI-based moving average. The CORE price is trading below the key moving averages, demonstrating the negative sentiment.
Will There Be Intense Buying Pressure After Breakout?
$CORE struggling to break above resistance
— Alice james (@alicejamess01) June 21, 2024
Needs to see a confirmed breakout for continuation of the uptrend pic.twitter.com/jknSo1HECb
The chart structure displays that the Core price has been falling by facing resistance from the trendline. The price has struggled to trigger a breakout from the trendline for the past few weeks. According to a source on X, a confirmed breakout is needed for a strong buying momentum.
Core Price Has Formed a Morning Star Pattern; Will It Gain 40% This Week?
The CORE price traded at $1.39 at press time with a neutral momentum in the past 24 hours. The market capitalization is $1.24 Billion, and the 24-hour trading volume is $102.22 Million. The circulating supply is 894,313,069 CORE, and the total supply is 2,100,000,000 CORE.
Based on the chart, the Core price has developed a morning star candlestick pattern on the support level. The price has dropped below the 200-day EMA, but sellers weren’t too strong to continue the bearish momentum.
Suppose the digital asset price surpasses the 200-day EMA and the volume increases, buying momentum can be observed. The chart structure needs to attract investors to overcome the major resistance level of $2.75.
On the other hand, the price below the support level of $1.40 is a bearish sign, and selling momentum can be expected. The recent trend is bearish, so sellers may easily drag the price down to the $0.560 mark.
Performance
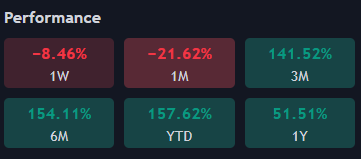
Core price has remained bullish on a wider time frame while sellers have shown interest in the short term. The price has risen by 51.51% in a year and 157% YTD. The CORE price has lost 21.63% in a month and 8.46% in a week.
Conclusion
The Core price has shown some bullish momentum at the support level, and there are signs of a potential buying opportunity if the price surpasses the 200-day EMA and the trading volume increases. However, it’s important to remain cautious as the price has struggled to break resistance levels, and the overall trend has been bearish.
Technical Levels
Based on the chart, the Core crypto price is expected to take support at the $2.00 and $2.75 levels. The price may take support at the $1.25 and $0.75 mark.
Disclaimer
This article is for informational purposes only and provides no financial, investment, or other advice. The author or any people mentioned in this article are not responsible for any financial loss that may occur from investing in or trading. Please do your research before making any financial decisions.


