
- PEPE price retested the trendline support zone and paused.
- Buyers are looking to resume the bullish momentum and trying for a rebound.
The most demanded memecoin, PEPE coin, faced profit booking and retested its trendline support zone of $0.00001000 in the last trading sessions.
This week, the PEPE price has rebounded from the 100 day EMA mark and made a hammer candlestick at the upward trendline zone. Amidst the sharp bull rally that happened in the past weeks, PEPE still has much more upside left and buyers are trying to resume the bullish moves ahead.


The memecoin has regressed to the breakout trajectory around $0.00001100 and is in a dilemma now. Once PEPE breaks above the $0.00001400, its could rise rapidly from that point.
Conversely, if the memecoin fails to hold the crucial support zone of $0.00001000, the sellers might dominate and could push it toward $0.00000760 soon.
At press time, PEPE was trading at $0.000001160 with an intraday surge of 3.06%, reflecting neutrality on the chart. It has a monthly return ratio of -22.02% and 600.20% yearly, reflecting short term retracement.
The pair of PEPE/BTC is at 0.000000000180 BTC, and the market cap is $4.88 Billion. Analysts are neutral and suggest that the PEPE may retain the strength and will resume to outperform in the upcoming sessions.
Will PEPE Bulls Defeat the Bear Army?
PEPE traded close to the 50 day EMA mark and was consistent to form the higher high swings. Interestingly, after a massive bull run, the memecoin was cooled off now and giving new investors to enter in this dip.
Notably, the memecoin was in buzz and has witnessed severe demand over the past few weeks. Along with the strong community, the technicals are favoring the rise and suggest that the bull rally might resume ahead.
Its trading volume soared over 48% to $483.21 Million and the market cap rose over 1.21% in the past 24 hours.
Notably, PEPE was ranked at 26 and has a total supply value of 420.69 trillion. Fueled by the strong community developments, the long term projections of PEPE were robust and it might continue its bullish saga ahead.
What do Social Metrics Indicate?
The Social Dominance data reveals a rebound and spiked over 33% in the last hours, implying the surge in the users engagement on the social media platforms.
Source: Santiment
Meanwhile, the X followers’ data witnessed a steep decline and dropped over 89% to the -25.6k mark, reflecting a negative outlook.
@CryptoFaibik in his tweet said that PEPE has formed a falling wedge pattern and might replicate a bullish rally soon.
$PEPE Falling Wedge formation on the Daily timeframe Chart..!!
— Captain Faibik (@CryptoFaibik) June 22, 2024
In case of Successful Upside Breakout, Expecting Another +80% Bullish Rally. 🔜#Crypto #PEPE #PEPEUSDT pic.twitter.com/L2YwFbbNYj
Source: X
Futures OI Data Reveal Long Buildup Activity
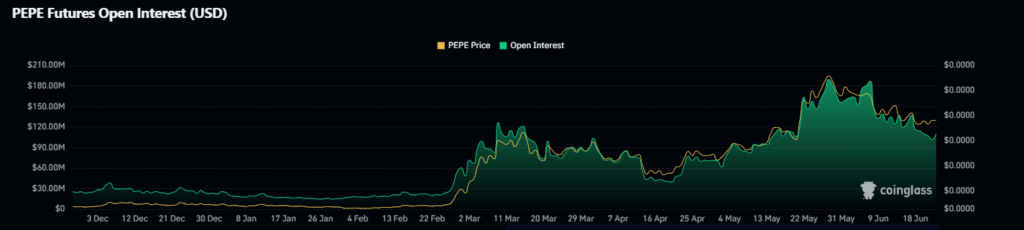
The open interest value surged over 4.30% to $115.44 Million, revealing fresh buyer accumulation and long build up activity in the last 24 hours
The immediate support levels for PEPE are $0.00001020 and $0.00000870, whereas the key upside hurdle is around $0.00001320 followed by $0.00001560
Conclusion
PEPE paused near its 50 day EMA mark and rebounded from its trendline support mark of $0.00001000. Notably, the memecoin consistently plotted higher high swings showing that the uptrend is intact on the chart.
Disclaimer
This article is for informational purposes only and provides no financial, investment, or other advice. The author or any people mentioned in this article are not responsible for any financial loss that may occur from investing in or trading. Please do your research before making any financial decisions.


