
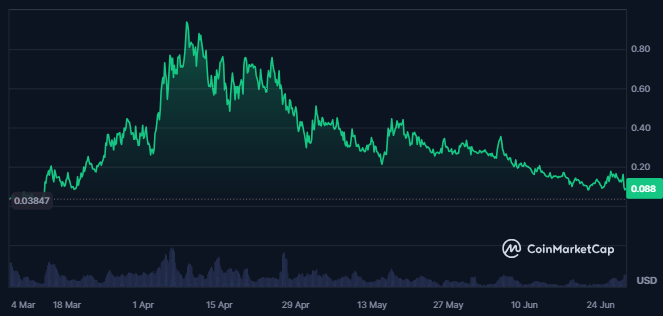
- The BODEN crypto price is down by 92% from its all-time high price.
- The crypto has witnessed a huge surge in its trading volume in the last 24 hours.
Jeo Boden (BODEN) is a cryptocurrency that has experienced significant price volatility recently. As of today, June 28, 2024, its price is around $0.08, with a circulating supply of 690.33 million tokens.
After a huge decline of 40% in the Jeo Boden crypto trading price, the price has advanced by 12% in the last 24 hours from the press time.


Moreover, the crypto has witnessed a huge surge of 113% in its trading volume over the last 24 hours from the press time. This has resulted in a traded value of $33.05M, resulting in huge liquidity. This is followed by a volume/market cap ratio of 55.34%.
The Jeo Boden crypto price volatility is exceptionally high, resulting in 36.31%, while the fear and crypto greed index is neutral at a level of 47. Additionally, the crypto market cap ranking is #2545.
The all-time high crypto price was achieved just three months ago, following the all-time low for crypto in March 2024. The crypto price has advanced by 368% since then as of press time.
BODEN Crypto Technical Analysis
The recent decline and profit booking in the trading price of BODEN crypto has led to a decline below crucial levels.
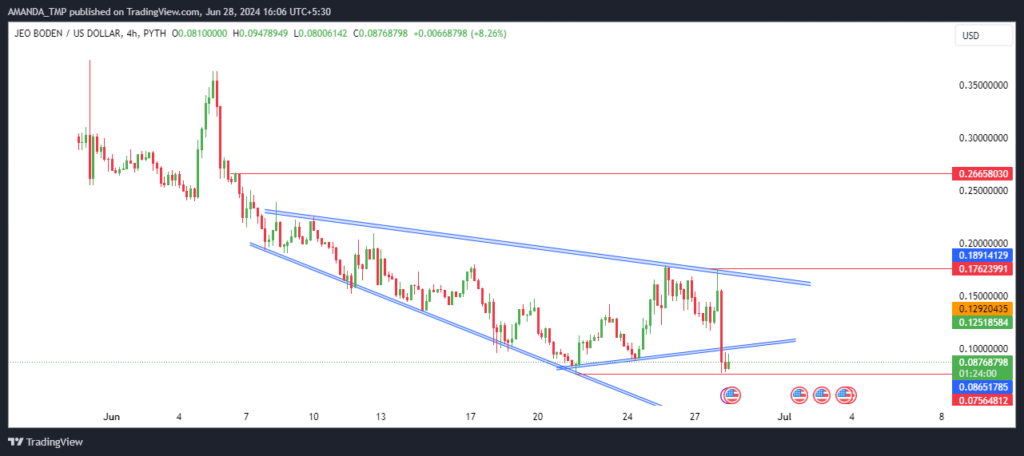
Looking at the 4H chart of BODEN crypto, it can be seen that the crypto price has started to witness consistent profit booking from the swing high of $0.3636776.
The crypto price has lost its value by more than 75% from the following swing high. This was followed by the formation of lower swing highs and lower lows over the last four months.
The following decline in the price of the crypto also led to the formation of an expanding falling wedge pattern. Additionally, there is strong support for $0.0750, and if the crypto price further slides below this level, a strong decline might be seen again.
Also, if the crypto price tries to rebound, it must break above the higher band of the falling wedge pattern and close above the same on the 4H chart. Moreover, a strong change in character level of $0.1765 must be taken out for a bullish trend in the crypto.
BODEN/USDT Chart by TradingView
On a 4H chart of BODEN crypto, the price has declined below the 20-day and the 50-day EMAs, trading in a death cross. This shows a bearish trend in the crypto price.
Additionally, the crypto price has declined below the lower band of the Bollinger band and has given a closing below the same. This shows the breakdown in the crypto price followed by huge volatility.
The MACD and the signal line are trading in a bearish cross, followed by the bearish histogram formation. The signal line on the 4H chart also has declined to the negative trajectory.
After hitting the overbought zones, the RSI has declined below the 50-level and the 14-day SMA. This shows a decline in the crypto momentum followed by a rise in the bearish momentum.
BODEN Crypto Dropped 92% From ATH Amid Bearish Signals
BODEN crypto plummets 40%, now down 92% from its all-time high. Despite a brief 12% rebound, its technical indicators signal a bearish trend, including MACD, RSI, and EMAs.
High volatility and profit booking continue to pressure prices, with further declines likely if key support levels are breached.
The support levels for the BODEN crypto price are $0.1670 and $0.07560, followed by the resistance levels of $0.17620 and $0.2660.
Disclaimer
This article is for informational purposes only and does not provide any financial, investment, or other advice. The author or any people mentioned in this article are not responsible for any financial loss that may occur from investing in or trading. Please do your research before making any financial decisions.


