
- The RPL crypto price has lost more than 45% in the last 2 weeks.
- The LDO price has slipped below the key moving averages, showing sellers’ interest.
From the beginning of its launch, the RPL crypto price has shown weakness, while the LDO crypto price chart has displayed very slow and steady gains. LDO price has faced resistance from the 200-day EMA and has dropped by 20% in a day, which has led to a death crossover in RSI.
Since mid-April, the RPL price has struggled in a parallel channel at press time. On June 14, the RPL price was pumped by 92% with a breakout from the channel, which was dumped later. After the breakout from the channel, buyers weren’t strong enough to continue the trend, and the price slipped back to the parallel channel.


LDO & RPL Price Forecast Based on RSI Analysis
For RPL Crypto
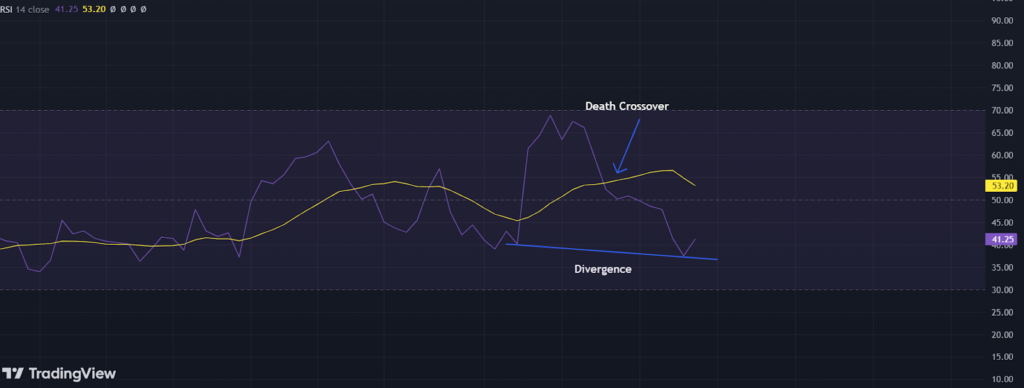
RSI is 41, generating a bearish crossover with the RSI-based moving average and heading towards the oversold zone. It has also formed a bearish divergence, which showcases the bearish forecast. Overall, the Relative Strength Index (RSI) supports the bearish forecast.
For LDO Crypto
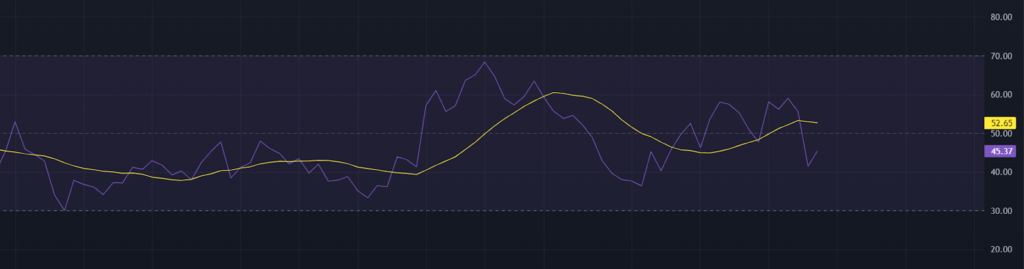
The Relative Strength Index is 45, which has developed a death crossover with the RSI-based moving average. The RSI is eyeing for the oversold zone, a strong bearish sign.
Technical Analysis of RPL Over 1-D Timeframe
RPL crypto was being traded at $20.03 with an intraday gain of $4.65% at press time. The market capitalization was $408.71 Million, and the 24-hour trading volume was $9.43 Million at the time of writing.
According to the chart structure, the Rocket Pool crypto price has been defending the major support level of $20. If the price slips below the major support level, it would record a new all-time low.
On the other hand, if the RPL price takes support at the $20 mark and forms a positive candlestick, it may help in a bullish momentum. Suppose the digital asset price surpasses the 200-day EMA; trend reversal can be expected.
LDO Price Has Shaped a Descending Triangle Pattern
LDO was being traded at $1.97, which increased by 5.28% in an intraday session at press time. The market capitalization was $1.76 Billion, and the 24-hour trading volume was $345.40 Million.
On a daily time frame, the Lido DAO crypto price chart has formed a descending triangle pattern and is currently at the support level. Bears may express interest if the digital asset price triggers a breakout from the triangle and sustains.
The Lido DAO price has witnessed slow and steady growth at the larger frame per the chart. If the price develops a swing at the support level and rises, it may continue the bullish trend for the longer frame.
Will RPL and LDO prices turn Bullish Soon or Keep Falling?
RPL crypto was more bearish than LDO at the time of writing. The RSI has favored the bearish forecast for both cryptocurrencies. RPL price is at the major support level and is about to record a new all-time low after the breakdown. LDO crypto price has formed a descending triangle pattern over the daily time frame. A breakdown may lead to strong selling pressure.
Disclaimer
This article is for informational purposes only and provides no financial, investment, or other advice. The author or any people mentioned in this article are not responsible for any financial loss that may occur from investing in or trading. Please do your research before making any financial decisions.


