
- A vast surge was recorded in the Toncoin TVL.
- TON crypto has given massive returns of more than 400% in the previous 1 year.
The Open Network (TON), initially developed by Telegram, is a scalable blockchain platform supporting millions of transactions per second through sharding.
It facilitates payments, dApps, decentralized storage, anonymized networking, and DNS. Despite regulatory challenges halting Telegram’s involvement in 2020, the TON Foundation now oversees its development.


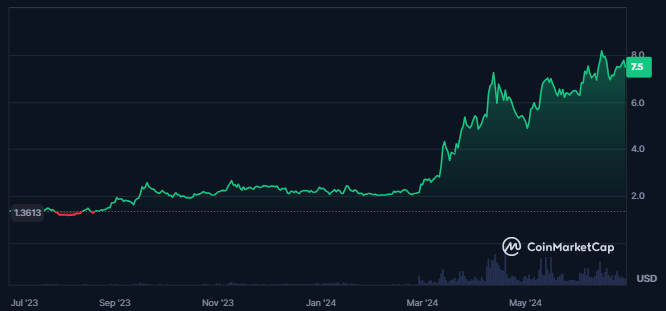
The price overview chart of Toncoin shows a consistent advance in the trading price of the crypto over the last 1 year. It shows solid bullish sentiment for crypto among investors and traders.
Despite the surge in the price, the crypto has been sitting quiet for the last 24 hours, followed by a decline of 21% in the trading volume. Additionally, the market cap has also declined by 1.4%.
The liquidation of the crypt was very low at 1.08% at the time of writing. The maximum supply of the crypto is infinite. The fully diluted market cap of the crypto was worth $38.244B, and the spot market cap at press time was $18.416B.
The trading price of the TON crypto was up by 1800% from its all-time low (ATL) price at press time. The ATL was achieved three years ago. Moreover, the price of the Toncoin is trading very close to its all-time high.
Onchain Data Overview Of Toncoin
The Total Value Lcoked (TVL) for the crypto has witnessed consistent advance over the last few months, showing that a larger chunk of money is invested in the crypto environment over time. It also represents the gain in investors’ confidence in the crypto.
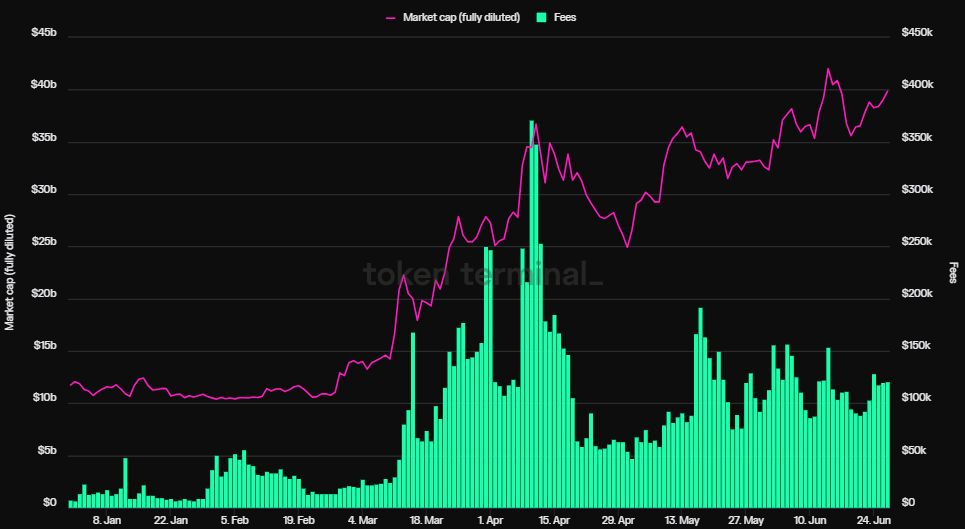
In February 2024, the fully diluted market cap of the crypto was $10.559B, which has advanced to $39.84B at press time. It shows that a larger number of tokens are yet to enter the market.
That phenomenon could dilute the holding of the existing investors in the future. The platform fees of Toncoin have further stabilized and are static over the last few weeks.
There has also been a surge in the number of crypto token holders in the last 30 days, increasing to 31.62M holders.
A surge in the crypto’s stablecoins market cap is also recorded, showing greater stability and liquidity.
What Do Technical Charts Have For TON Crypto
The price of the TON crypto has been taking support at a dynamic trendline at press time. It has advanced by 60% from the swing low of $4.60.
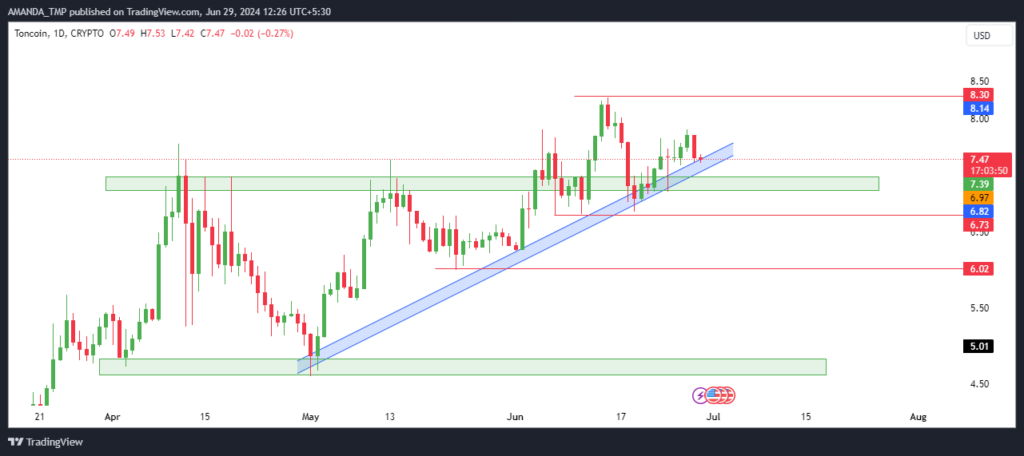
Looking at the overall structure of the crypto price, it is evident that the TON price has broken above the strong resistance level and sustained above the same.
The TON crypto price is trading above crucial breakout levels at press time, and the trendline has also sustained. It shows a higher probability of further surges in the price.
TON/USD Chart by TradingView
The TON crypto price followed a solid rising momentum, and there was a golden crossover between the 50-day and 200-day EMAs at press time. Additionally, the deviation between the 200-day EMA and the 50-day EMA was more than 35%, showing a solid uptrend in price.
When writing, the MACD and the signal line traded in a bullish trajectory, while the metrics traded in a death crossover. It showed temporary profit booking and retracement in the TON price.
The RSI followed a bullish cycle on the daily chart and was at 53.93 at press time. It showed strength in the rising momentum of the crypto and a higher probability of a surge in the price of the crypto in the future.
Summary
Toncoin surged over 400% last year, with a TVL increase and a bullish price trend. Despite a recent drop in trading volume and market cap, its price remained close to its all-time high. Technical indicators, including a golden cross and strong RSI, suggest further upward potential.
The support levels for the TON crypto at press time are $6.00 and $6.80, and resistance levels of $8.30 and 10.0 are on the higher side.
Disclaimer
This article is for informational purposes only and does not provide any financial, investment, or other advice. The author or any people mentioned in this article are not responsible for any financial loss that may occur from investing in or trading. Please do your research before making any financial decisions.


