
- OM Crypto has a total of 11.5K holders, according to analysts.
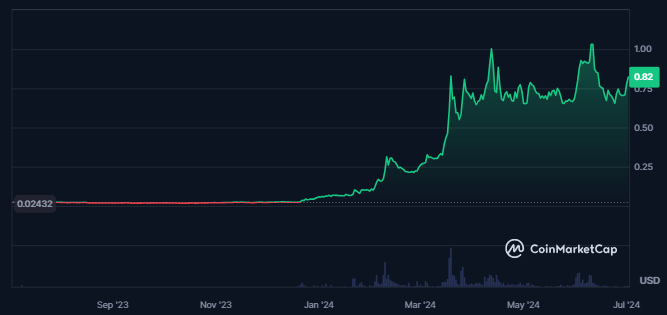
- The Mantra crypto price has advanced by 3450% in the last 1 year.
MANTRA is an ERC-20 token on Ethereum, serving the MANTRA DAO platform focused on staking, lending, and governance.
OM is used for staking rewards, governance participation, lending and borrowing, and ecosystem incentives. Created by FinTech entrepreneur John Patrick Mullin, it supports decentralized finance operations and community decision-making.


The Mantra crypto’s 87% of the holders are in profit, while only 6% are in loss, as per IntoTheBlock. The Onchain signal of the crypto further is strongly bullish, followed by a positive crypto network.
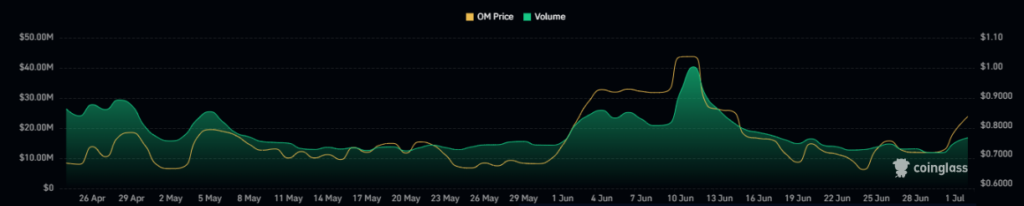
The liquidity of the crypto is slightly lower, resulting in a volume/market cap ratio of 2.57%. The value of the traded volume for the crypto has declined by 2.8% in the last 24 hours from the press time.
The Mantra crypto traded volume in the last 24 hours is worth $17.546M, followed by a market cap value of $683.725M. Additionally, the Total Value Locked for the crypto is worth $881K.
Following the TVL, the crypto’s market cap/TVL ratio is 772.79, and the circulating supply of the crypto is 830.661M OM. Its fully diluted market cap is $731.964M, and the price has advanced by 4646% from its all-time low price.
At press time, 6.46% of the crypto market cap is staked, resulting in a value of $44.09M. Also, the liquidity of the crypto is worth $3.75M, and Mantra DAO has borrowed $25.68M from the market.
Mantra Crypto Derivatives Data Analysis
The value of the Mantra crypto derivatives trading volume has advanced by 12% in the last 24 hours, resulting in a traded value of $77.83M.
The recorded short liquidation for Mantra crypto over the last 24 hours is worth $62.96K, more than double the longs liquidated in the crypto.
Additionally, the long/short ratio of the crypto is 0.9316, and the open interest in the crypto has advanced by 22.2% in the last 24 hours. It shows an advance in the number of open positions in the crypto.
OM Crypto Technical Analysis
Strong bullish candles are formed on the daily chart of OM crypto, which shows buyers’ dominance, followed by a strong bullish trend in crypto.
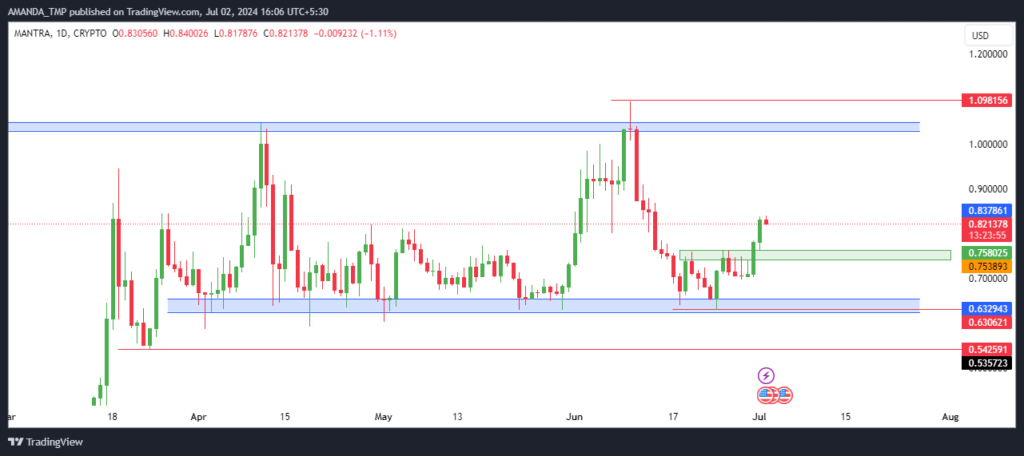
Trading inside a consolidation zone, the OM crypto price has broken above a strong resistance, which is reliable for a short-term rise in the price. As the crypto price has broken above the following level, it might continue to surge to the next resistance of $1.030.
OM/USD Chart by TradingView
The deviation between the 50-day and the 200-day EMAs is 38%, followed by a golden cross between the EMAs. It shows a strong uptrend in the crypto price. The OM crypto price has also sustained above both the EMAs.
The MACD is forming a bullish setup, and the MACD and the signal line have formed a bullish cross. The histograms are also bullish, while the indicators’ metrics remain negative.
Thus, waiting for the metrics to break above the bullish trajectory might help confirm a bullish trend in the price.
The RSI further exhibits a bullish behavior as the RSI has crossed above the 14-day SMA and 50-level and has sustained above the same. Additionally, it has been following a bullish cycle, closing above the overbought zone.
OM Token to break resistance
Mantra has seen a 3450% price increase over the last year, with 87% of holders in profit.
Strong bullish trends, high derivatives trading volume, and technical indicators suggest continued upward momentum. With OM breaking resistance and forming bullish patterns, it may reach the next resistance level of $1.030.
The support levels for the OM crypto are $0.5420 and $0.630, followed by the resistance levels of $1.0980 and $1.50.
Disclaimer
This article is for informational purposes only and does not provide any financial, investment, or other advice. The author or any people mentioned in this article are not responsible for any financial loss that may occur from investing in or trading. Please do your research before making any financial decisions.


