
- A huge surge in BEAM crypto’s trading volume has been recorded during the last 24 hours.
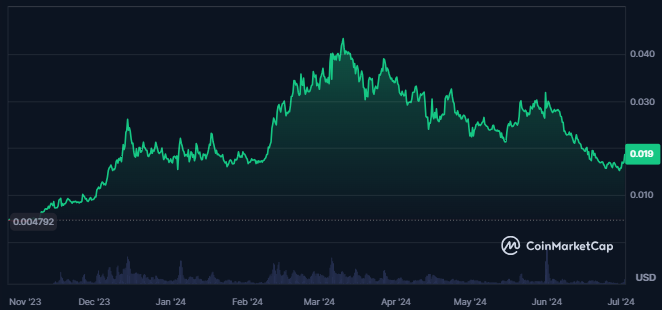
- The Beam crypto price is down by 57% from its all-time high price.
The Beam network, leveraging the $BEAM token, combines privacy, gaming, and decentralized governance.
Using the Mimblewimble protocol for confidential transactions, Beam offers tools for game developers, supports a decentralized exchange, and enables community-driven governance through the Merit Circle DAO.


With the rise in the trading volume of crypto, the price has also advanced. It shows strength in the rising momentum of crypto, which is supported by new investors gaining interest.
The market cap of the Beam further has advanced by 9.5% in the last 24 hours from the press time, resulting in a market cap value of $923.411M. Also, the crypto market cap ranking is #76, as per CoinMarketCap.
As per the analysts, the BEAM crypto price volatility is extremely high at 20.04%. That means the crypto price might fluctuate rapidly in a short period. Additionally, the sentiment of the crypto is bearish, and the fear and greed index of the crypto is neutral.
The circulating supply of crypto is 49.466B BEAM, which is 79.23% of the maximum crypto supply. It shows that most of the crypto supply has been mined since its launch in 2023.
Beam Crypto Derivatives Data Analysis
The trading volume of the crypto derivatives has also witnessed a huge surge of 214% in the last 24 hours, which has resulted in a traded value of $17.08M. It shows an increase in the demand for crypto.
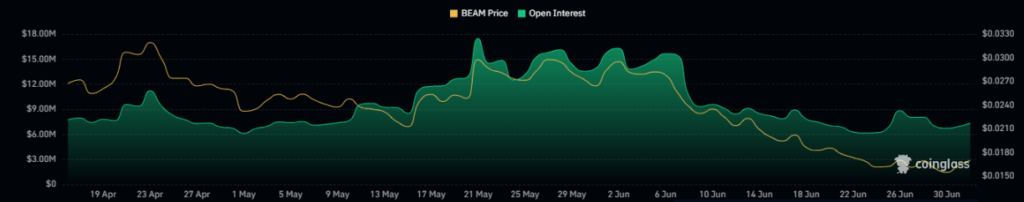
The open interest curve for Beam crypto has started to advance over the last few days. This shows a surge in the number of open positions for the crypto.
Additionally, the open interest in crypto has advanced by 51% in the last 24 hours, which has resulted in an open interest of $11.12M.
Also, the value of the longs liquidated for the crypto is nil, while the value of the shorts liquidated for the crypto is worth $943.85 over the last 24 hours. This shows that buyers are dominating over the crypto price.
BEAM Crypto Technical Analysis
The price chart shows BEAM crypto’s strong downtrend as the crypto price has consistently declined to lower levels over the last few months.
Consistent lower lows are formed on the daily chart of the BEAM crypto, which shows a strong bearish structure formed on the crypto chart.
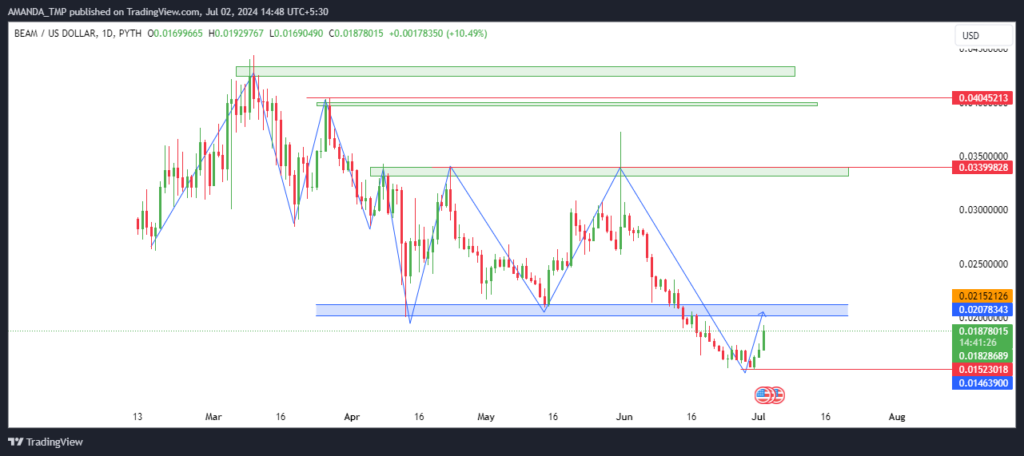
If the crypto price further tries to rise, it might face resistance at the higher levels and lead to a liquidity grab. That will lead the price to swing lows.
The most recent price action on the chart shows that the price has declined below strong support. The following breakdown in the price shows higher chances of continuation in the bearish momentum.
BEAM/USD Chart by TradingView
Technical indicators exhibit uncertainty in the price trend of the crypto. That’s because the 20-day and the 50-day EMAs are trading in a death crossover, while the price has broken above the 20-day EMA.
The MACD and the signal line are trading negatively, declining below zero. Despite this, the following metrics have formed a golden cross at lower levels.
The RSI also followed a bearish cycle, breaking above the 14-day SMA and trading at a level of 47 at press time.
Beam Crypto Witnessed Rising Momentum
Beam crypto’s recent trading volume surge shows rising momentum and new investor interest but remains 57% below its all-time high.
Despite gains in market cap and open interest, technical indicators suggest uncertainty. With high volatility and a bearish trend, Beam faces resistance and potential liquidity challenges.
If the BEAM crypto price continues to decline to lower levels, it might take support at the levels of $0.010 and $0.0140. Moreover, the resistance levels for the same are $0.034 and $0.040.
Disclaimer
This article is for informational purposes only and does not provide any financial, investment, or other advice. The author or any people mentioned in this article are not responsible for any financial loss that may occur from investing in or trading. Please do your research before making any financial decisions.


