
- Tron (TRX) has recorded one of the highest numbers of active addresses intraday.
- TRX price is displaying strong momentum.
Tron is a decentralized blockchain platform offering high throughput, scalability, and availability for DApps.
Its native cryptocurrency, TRX, is used for transaction fees and staking. Created by Justin Sun, Tron was aimed to establish a decentralized internet. It supports smart contracts, and DeFi services have been governed by a community DAO since 2021.


Tron is the 11th largest cryptocurrency in the global crypto market and has a very strong market presence. Its market cap dominance is 0.53%, followed by a market cap of $11.291 Billion at press time.
The crypto sentiment has been bullish, and 95% of the crypto holders are in profit, while only 4% of the holders have bought it at a higher price. The crypto concentration of the large investors is 66%.
On its official community page, Tron announced that it had burned 11.531 million tokens on July 2, 2024. This will deflate the crypto and might lead to a growth in its value.
#TRON just burned 11,531,634 #TRX on July 2nd 🔥 showcasing a commitment to deflation & value growth 🚀 With a net negative production ratio of -6,465,123 🤯 pic.twitter.com/JH33HsNi7h
— TRON Community (@TronixTrx) July 3, 2024
The maximum crypto supply further is infinite, while the circulating supply at press time is 87.184B TRX. The price also has advanced by 11700% from the all-time low price of $0.001091.
Tron Usage Statistics
The total value locked for the Tron crypto is worth $7.776B, rising over the last few days. Additionally, the stablecoins market cap of the crypto is $58.213B, which shows the stability of crypto.
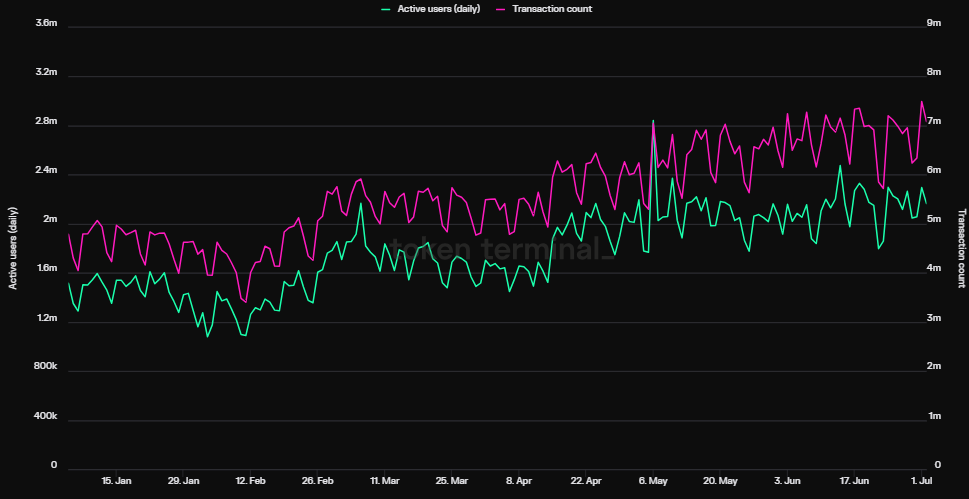
A surge in the daily active users of Tron can be seen on TokenTerminal’s charts. This further is followed by a huge advance in the transaction count. This shows that many users are engaged in the crypto environment.
TRX Crypto Technical Analysis
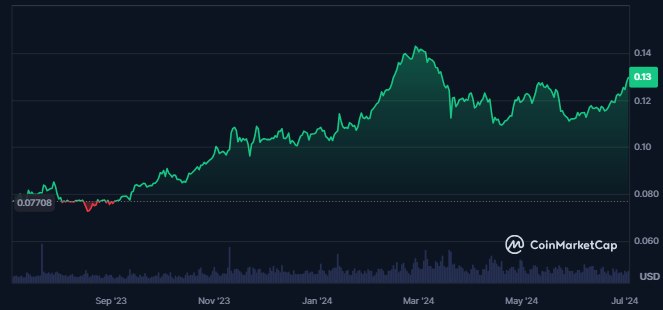
The price of the TRX crypto has been slowly and consistently advancing over the last few years.
The TRX crypto price has sustained a dynamic trendline for the last eight months, after which the crypto price has consistently advanced.
From the most recent swing low of $0.00110, which was hit on the dynamic trendline, the crypto price has advanced by 16% in just 35 days.
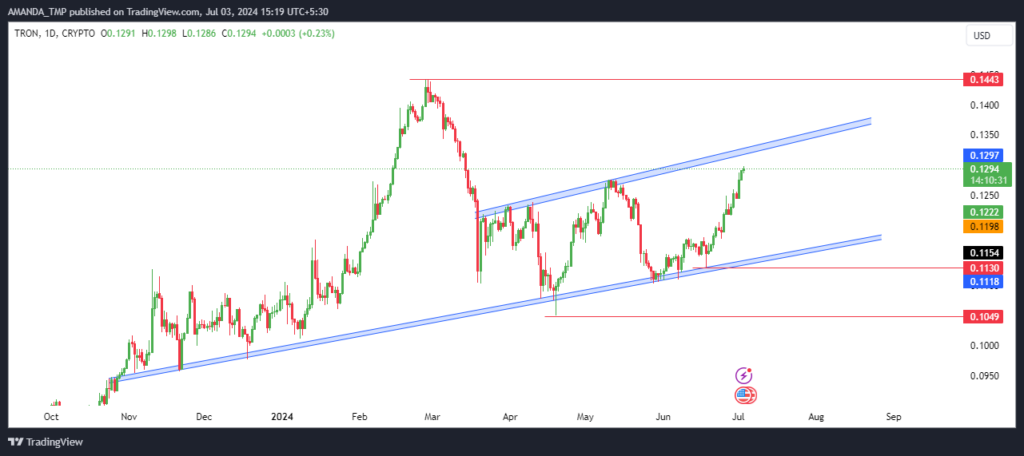
The crypto price is inside a rising wedge pattern, showing it is already in an uptrend. If the price further breaks above the pattern, a strong surge in the price might be seen.
TRX/USD Chart by TradingView
TRX was above the 50-day and the 200-day EMAs, and the EMAs formed a golden cross. Additionally, the crypto price was 7% ahead of the 50-day EMA, reflecting strength in the trend.
The MACD and the signal line have advanced to the bullish trajectory, followed by bullish histograms on the chart. Also, the metrics are trading in a golden cross.
The RSI has advanced to the overbought zone, followed by the breakout above the 14-day SMA. This shows strong dominance of positive momentum in the crypto.
The Tron (TRX) chart shows bullish momentum, triggered by a recent 11.531 million token burn.
The cryptocurrency showed significant positive trends, with 95% of holders in profit, increased active addresses, and TRX trading above key EMAs. Technical indicators including the MACD and RSI support continued upward movement.
The support levels for Tron are $0.1050 and $0.110, followed by the resistance levels of $0.1440 and $0.200.
Disclaimer
This article is for informational purposes only and does not provide any financial, investment, or other advice. The author or any people mentioned in this article are not responsible for any financial loss that may occur from investing in or trading. Please do your research before making any financial decisions.


