

- SHIB token price is back below the 20 EMA in the daily time frame
- The SHIB/BTC pair was trading at 0.00000000025 BTC with a loss of 2.12%
- The 24 hr trading volume in SHIB is $370.02 Million
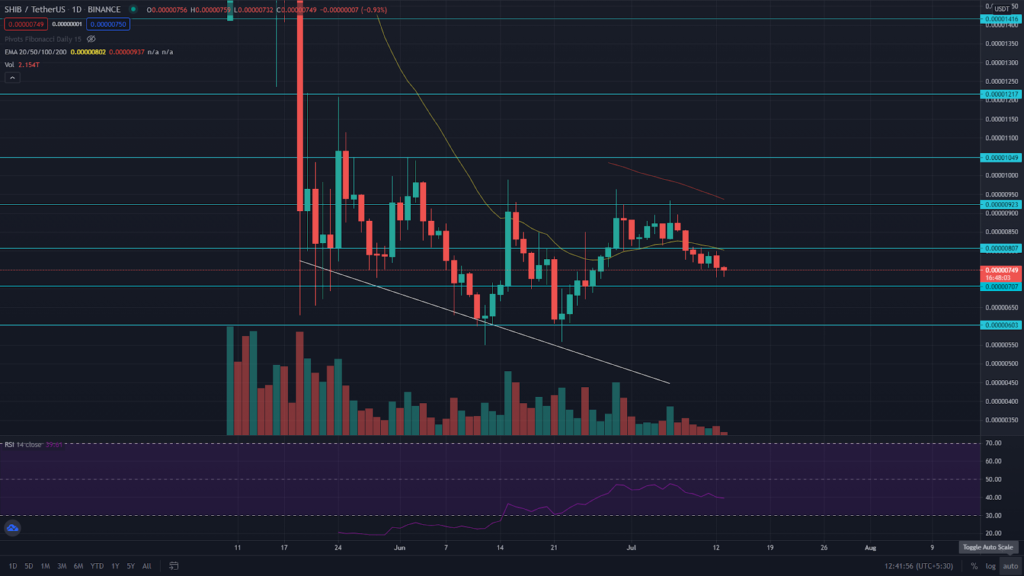
The SHIB token price has fallen almost 20% in a week after getting rejected from the $0.00000923 resistance level. Marching lower, the price has breached another support level of $0.00000812, coinciding with the 20 EMA. Thus, the price shows intense selling pressure in the SHIBU token, luring more short sellers in the market.
The RSI (BEARISH) value is 39 and keeps moving lower with the price, validating this current bearish market.


The SHIB Token Falling With A Steady Descending Trendline
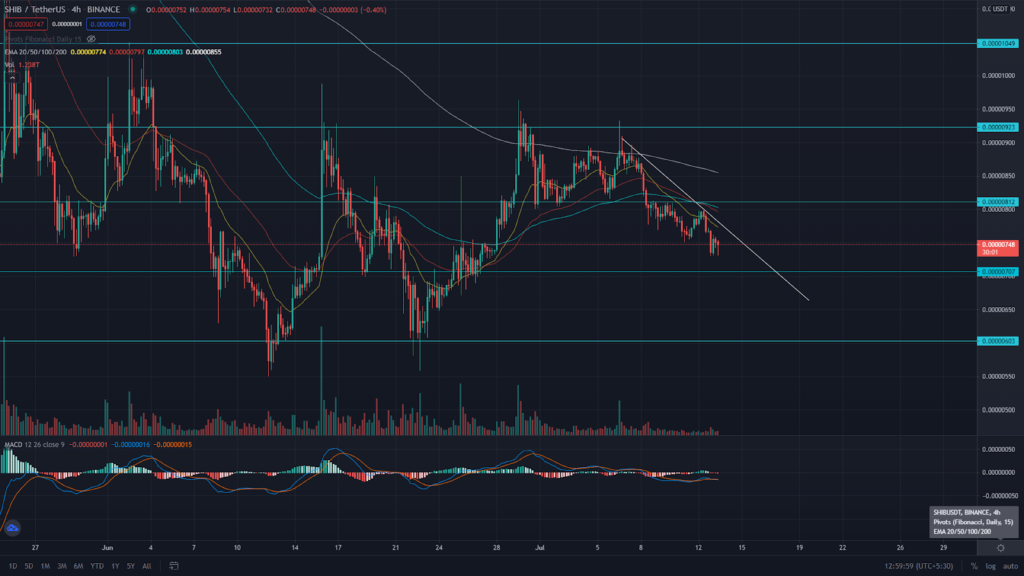
The SHIB token price shows a new descending trendline, assisting SHIBA in reaching the lower levels. Traders can use this resistance trendline to capture good shorting opportunities in the token. Moreover, the traders can also plot the traditional pivot levels in their chart as they show a remarkable confluence with the SR levels in the 4hr time frame, adding an extra edge in their trading.
Concerning the EMA, the SHIB token is trading below all the crucial EMA 20,50,100, and 200, indicating a bearish trend formation. In addition, the 20 EMA acts as a strong dynamic resistance to the SHIB token.
The MACD indicator (BEARISH) shows both the MACD line and the signal lines moving below the neutral zone(0.00). Moreover, these lines have also given a bearish crossover projecting a sell signal.
Conclusion: From the technical perspective, the overall trend of the SHIB token is strongly bearish. Both the price action and indicators are giving a bearish outlook with no signs of reversal yet. Thus, traders can look for good shorting opportunities in this coin. However, one support level that stands between the targeted $0.000006 mark is the $0.000007 support, and if the price breaches this level, it will add great confirmation for SHIBA falling back to the $0.000006 level.
Support– $0.000007, $0.000006
Resistance– $0.00000810


