

- XLM coin price action is in an uptrend of 4.1% during the intraday trading session.
- The 24-hour trading volume is at $555 million.
- XLM/BTC pair is trading negative by 1.1% at 0.00000661 BTC.
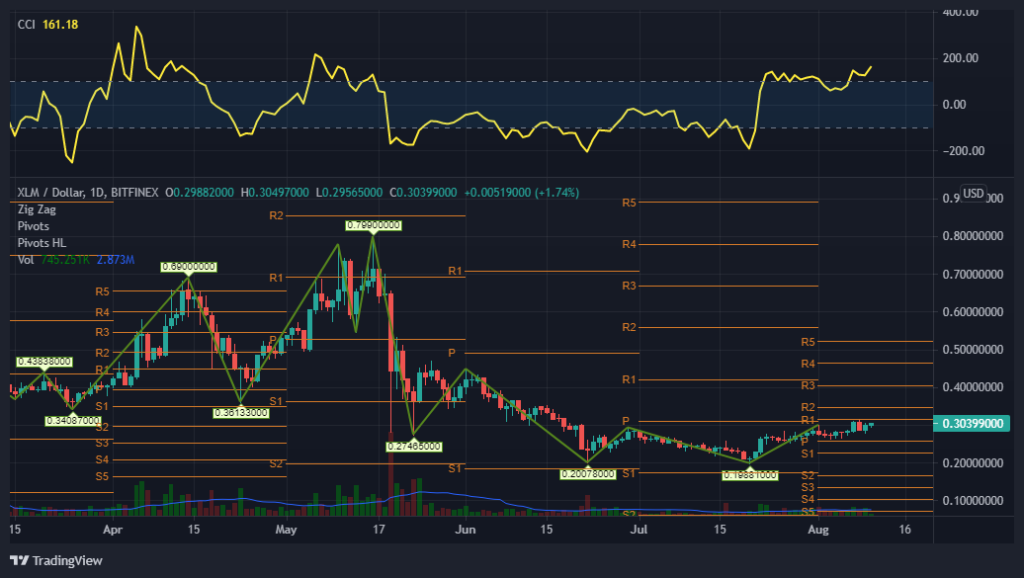
The daily technical chart of the XLM coin displays an upward trend. According to the pivot levels, the primary support level is $0.25. On the other side, if it rushes up, the resistance level to follow is $0.31. Although the chart forms a Doji candlestick pattern within the day, it is predicted that the price may remain sideways with medium reliability.
The Zig-Zag framed a top of $0.79 on 16 May. After that, investors can notice a massive correction of 75%, all the way low to $0.19. Now price levels are back around the range of $0.30 this week.


The volume of (749.05K) is below the MA of 20-days (2.873M). As a result, volume is low in XLM, causing its price to struggle around the resistance zone. Investors may also mark that the volume bars on the chart are declining, which intimates that notable volatility is expected in the upcoming trading session.
The CCI indicator gave a (bullish) signal with 160, projecting a buy signal in the XLM coin. Investors may observe an inclining slope from 66 to 160. It may surge in future trading sessions.
Stellar (XLM) Coin Needs Increase in Momentum
Today’s Stellar price is $0.304447, and the 24-hour trading volume is $555,059,850. The price of XLM coin has increased by 4.1% in the past 24 hours. Its circulation is 23 billion XLM coins, with a total of 50 billion. In addition, the price struggles around the resistance zone. The CCI indicator shows a buy signal, and the traders have guided low volume. Technically, the price shows signs of sustainability and remains in an uptrend. Therefore, as with overall market sentiment, the trend remains bullish.
Resistance Level: $0.31
Support Level: $0.25


