

- SHIB Token price has increased more than 200% in the past week.
- The price action forms a solid uptrend supported with an ascending trendline in the daily chart.
- The pair of SHIB/BTC is trading at 0.000000000474 BTC with an intraday gain of +16.54%.
SHIB coin price action forms continuous bullish engulfing candlesticks in the daily technical chart, indicating increased buying pressure. Furthermore, the price action shows an uptrend in action with the support of an ascending trendline.
The intraday volume is above the 20-days volume MA representing that the buying pressure is increasing. In Addition, the daily EMAs rise higher in a bullish alignment, projecting a bullish rally.


The SHIB Token price trades at $0.00002533, increasing +13.65% in market capitalization over the past day, suggesting that the price is in a bull run.
SHIB’s intraday trading volume has risen by 52% due to the increasing buying pressure.
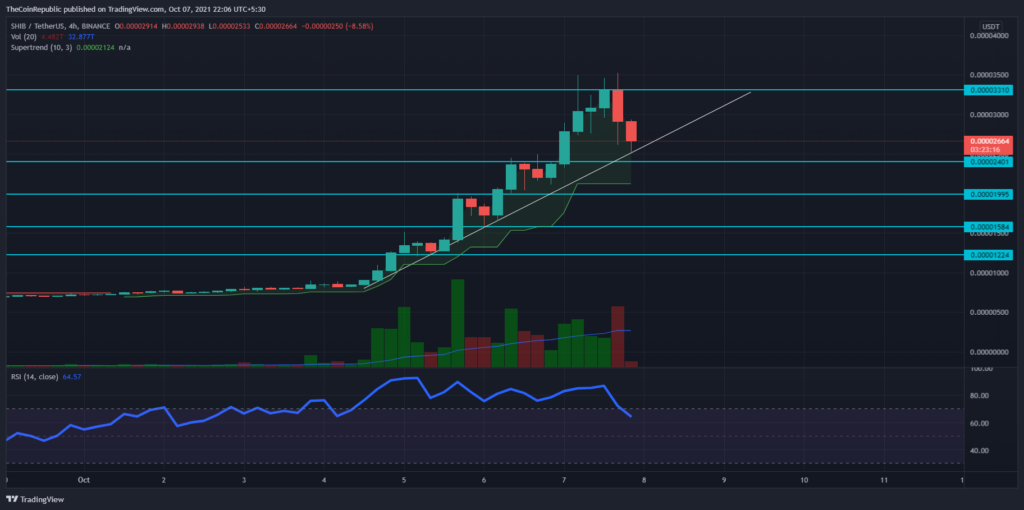
SHIB Token In The 4-hour Chart
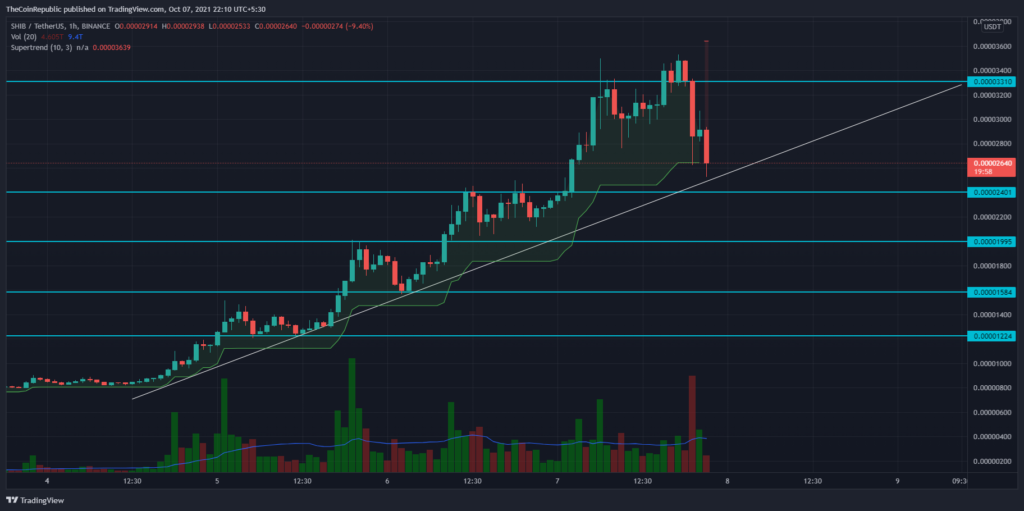
SHIB token price shows higher price rejection as it fails to rise above the $0.00003310 mark. However, investors may find the retracement to the support trendline as a lucrative entry spot with minimum risk and maximum reward.
As per price action, the support levels for the token are residing at $0.00002416 and $0.00001995 marks. In the case of a bullish reversal from any support level, bulls may find resistance at $0.00003310 or $0.00004220.
The EMAs in the 4-hour technical chart climb higher in a bullish formation with a positive slope that may support the prices in a bearish attack.
The RSI indicator anticipates a flood in underlying bullishness as the slope of RSI spikes higher.
The ADX indicator proposes a rise in trend momentum.
Conclusion – The SHIB token price rises higher in a solid uptrend with the backing of a strong support trendline in the daily chart. The recent reversal from the resistance might soon drive the price below the support trendline.
Support – $0.00002416 and $0.00001995
Resistance – $0.00003310 or $0.00004220.


