

- The DGB coin price fighting to break above the 55-EMA during intraday
- The 24-hour trading volume is at $63 million.
- DGB/BTC pair is trading positive by 9.0% at 0.00000085 BTC.
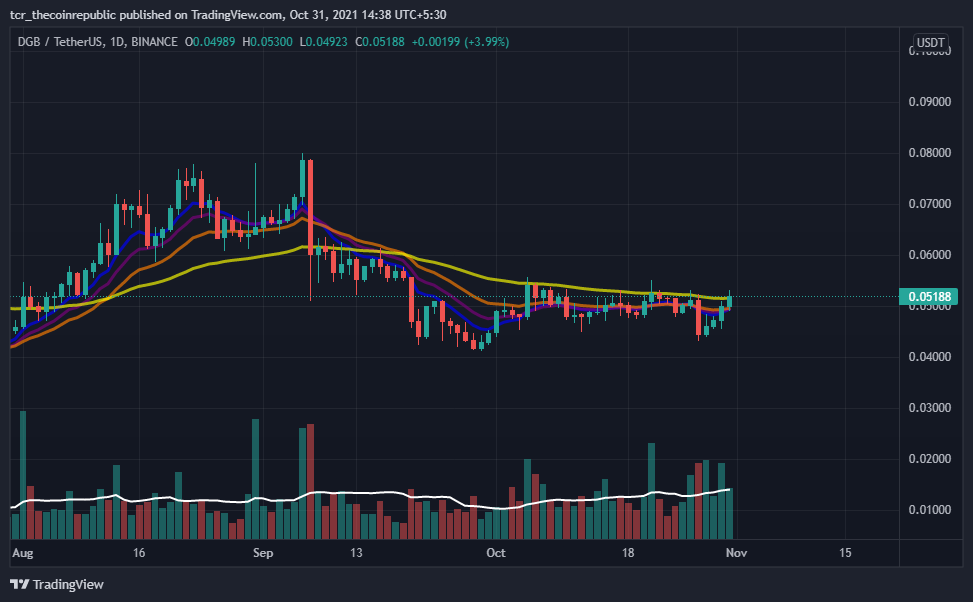
The Moving Average (EMA) on the daily price chart of DGB coin, which includes the 8,13,21,55 EMA, acts as reliable support for currency price movements. Investors may notice prices trying to break above the yellow line, ensuring a Digibyte uptrend until the price resides above the EMA’s.
Trading volume (164.576 M) is above the 20-day moving average (158.512 M). The volume is high and increasing, so the cost is moving upside. Investors may also notice an increase in volume. This indicates that unusual fluctuations are standard on the following trading days.


DGB Coin Price Bullish Behaviour Spotted on The Charts
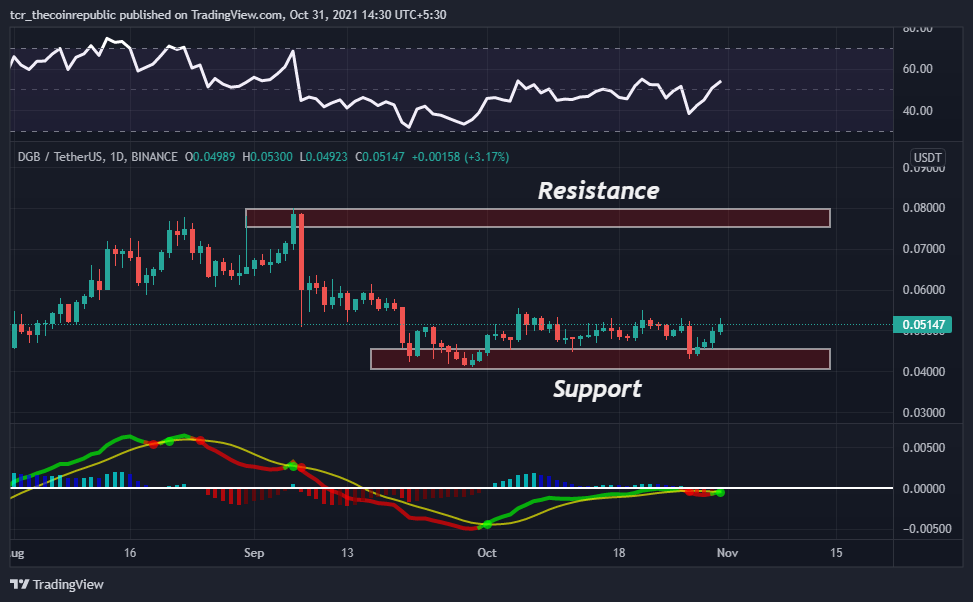
DGB coin daily price charts show an uptrend. Based on the price action, the support range is $0.040 – $0.0450. On the flip side, the resistance area you should be looking for is $0.075 – $0.080.Therefore, the chart shows a bullish harami candlestick pattern during the day.
The RSI showed a 54 (bullish) signal, Expecting to buy in the short term. Investors may find that the RSI line is sloping upside on the indicator. It may arise in the coming trading days.
The MACD shows a (bullish) cross above the signal line on October 31st, indicating a buy signal for the currency. In addition, investors can see the end of red bars in the histogram indicator.
Conclusion
The price of Digibyte Today is $0.051736 on a 24-hour trading volume of $63,551,158. DGB prices have risen 9.0 percent in the last 24 hours. Its current supply is 15 billion DGB, and its total supply is 21 billion.
RSI and MACD indicate a buy signal. Traders have directed high volume. In fact, the cost has bounced from the support zone. A market overview also shows that this pattern will continue to rise in the coming trading days.
Resistance Level: $0.075- $0.080
Support Level: $0.040- $0.450


