

- The RSI line displays a bearish divergence concerning the OMG token price
- The OMG/BTC pair was trading at 0.0002873 BTC, with a gain of 2.9%
- The OMG coin’s 24-hour trading volume is $3.85 Billion
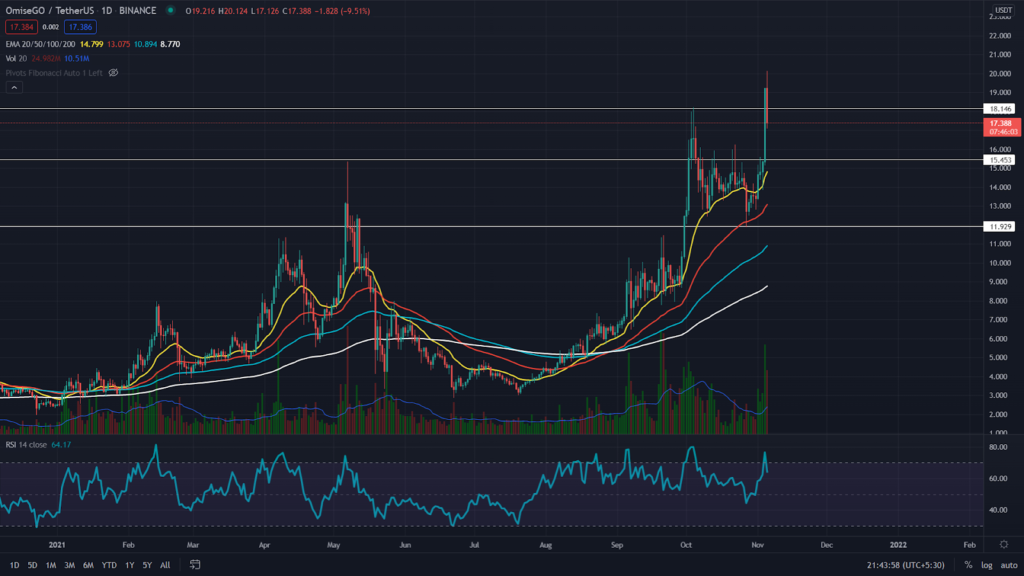
On November 4th, the OMG token chart indicated an excellent long opportunity for crypto traders when its price breached the previous All-Time High of the $18.1 mark. However, today the price retracement back to this retest level, and rather than taking support from it, the coin price dropped below the $18.1 level suggesting a fakeout.
Concerning the EMAs, the OMG token prices trade higher than the EMAs 20, 50, 100, and 200, projecting a solid bullish alignment in its chart.


The RSI value of 64 indicates a bullish sentiment within the OMG token. However, the RSI also shows a bearish divergence in its chart, suggesting some weakness in this coin.
The OMG Token In The Lower Time Frame Chart
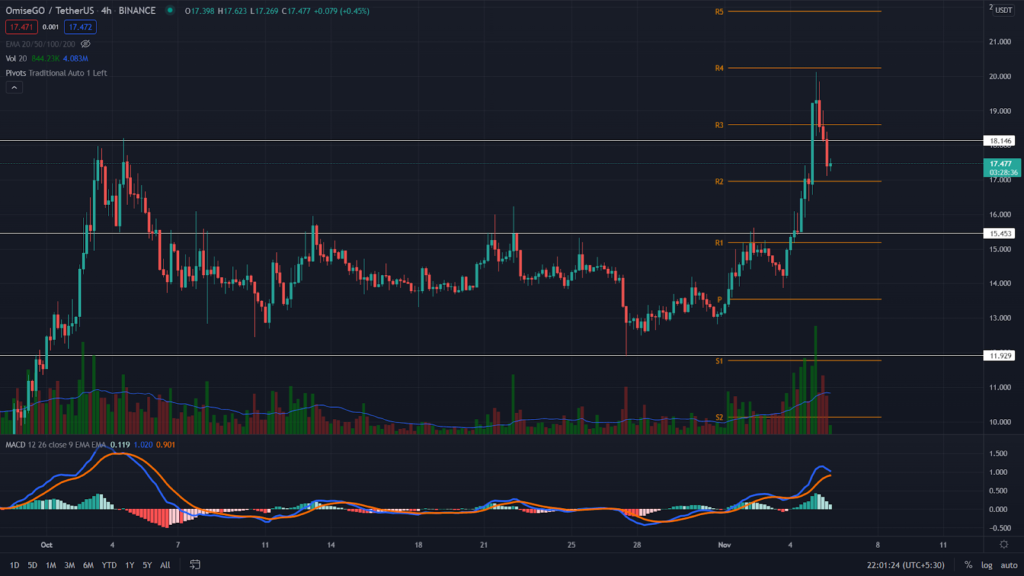
The OMG chart displays a decisive breakdown candle from the $18.1 mark in this lower time frame chart. However, even in fakeout, a retest can be expected to check for a valid resistance level. If the token indicates some supply pressure at this level, the price drops to a lower chart level.
As per the traditional pivot levels, the nearest resistance for the OMG price is $18.6, followed by 20. And for the opposite side, the nearest support these traders can expect is $17, followed by $5.2.
The Moving average convergence divergence(MACD) indicator supports OMG’s current price action, as its lines have just crossed above the neutral zone, indicating a bullish momentum regarding this token.
Conclusion: The technical outlook for the OMG token is strongly bullish. However, A fakeout from a crucial resistance often provided a decent fall at least to a significant support level. Thus, the OMG traders can consider a decent short opportunity if the price sustains below the $18.1 mark.
Support: $17
Resistance – $18.6


