

- The VLX coin obtains strong support from the 20-day EMA
- The VLX/BTC pair was trading at 0.000008983 BTC with a gain of 19.52%
- The 24-hours volume for the VLX coin is $28.8 Million
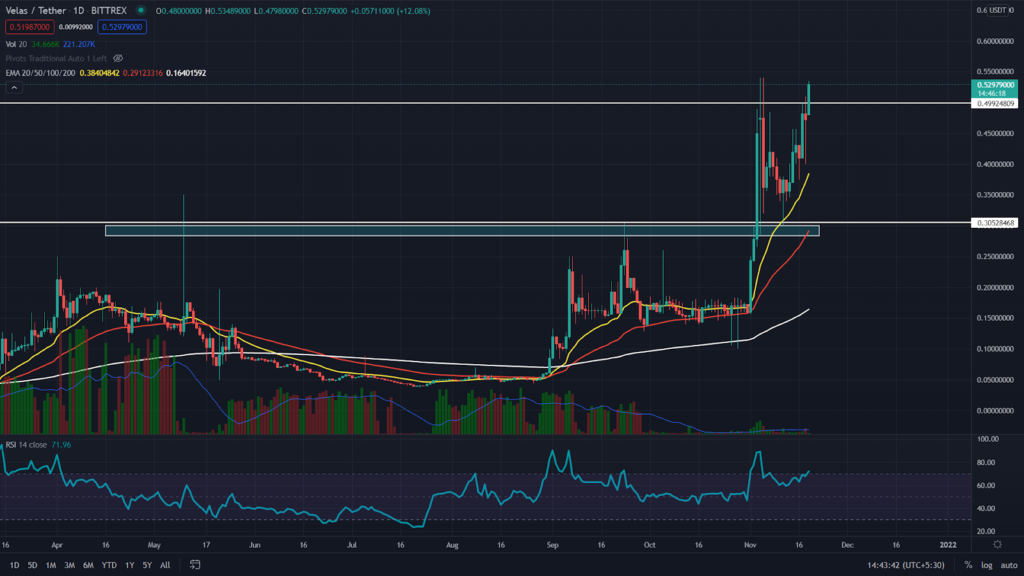
On November 5th, the VLX coin chart provided an excellent long opportunity for crypto traders when its price breached the $0.3 neckline of the Cup and handle pattern in the daily time frame chart. However, the breakout candle was so massive that it displayed a 61% gain in its intraday session. Later the coin price was rejected from the $0.5 level and pullback to retest the news support of $0.3.
Regarding the EMA’s, the VLX coin price is trading significantly above the crucial EMA’s of 20, 50, 100, and 200, indicating a bullish trend alignment. Moreover, the 20 EMA is providing good support for this coin.


The RSI (BULLISH) current value is 72, indicating a bullish sentiment within the VLX coin.
The VLX Coin Chart In The 4-hour Time Frame
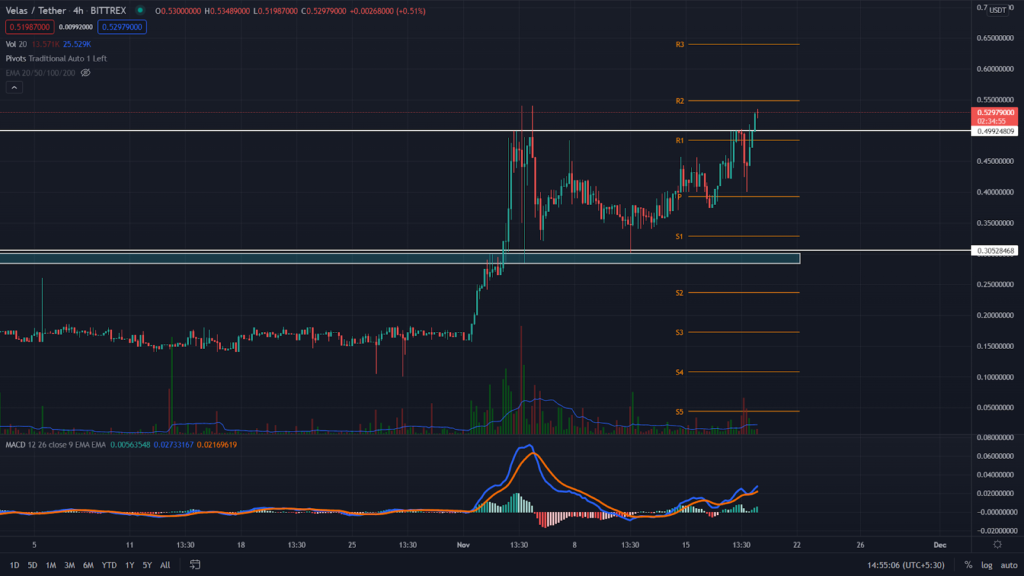
The retracement phase in the VLX coin obtained good support from the $0.3 mark and bounced back from this level to continue to rally. The coin price breaches the All-time high resistance of $0.5, offering another long entry opportunity.
According to the traditional pivot level, the nearest resistance level for VLX price is $0.55, followed by $0.64. Moreover, the crypto traders can expect the nearest support at $48.5 and later $0.39. The MACD indicator shows both the MACD signal lines moving above the neutral zone (0.00), indicating the strong bullish momentum in the VLX coin.
Conclusion: From a technical perspective, the overall trend of the VLX coin is strongly bullish. And, as mentioned above, the chart displays even more potential for this coin with the breakout of $0.5 resistance, and the crypto trader can grab a good long opportunity if the price sustains above the broken level
Support: $0.50
Resistance: $0.55


