

- Bitcoin Price fell 5% and dropped below the support of $26,000.
- BTC Price is trying to defend the 200 day EMA placed at $25,206.
- Bitcoin Cryptocurrency fell and dragged down the majority of Altcoins.
Bitcoin Price fell 5% in a single day and dropped below the important support of $26,000. It hurted the market sentiment and negatively impacted the prices of other Altcoins.
BTC Price failed to keep the price above the 50 day EMA shows the short term trend is reversing down. However, the price is near to the 200 day EMA which will act as immediate support in the coming weeks.


From the past few months, Bitcoin Price consolidated in the wide range between $25,200 to $31,000. It formed a short term base near $25,200 due to the previous breakout.
Bitcoin Price faced hurdle near to the $30K level and slowly it began to decline and returned back to the breakout level. However, The trading volume in BTC crypto remains low despite the downfall indicating the signs of a trap for the sellers.
Bitcoin crypto price trying to defend the demand zone to keep the long term trend in upward direction. Bulls have to come forward else the sellers will take over all the control and erode the previous gains.
Bitcoin Price is trading at $25,811 with an intraday rise of 0.32%. The 24 hour volume to market cap ratio is 0.0413.
Bitcoin Price crucial support $25K at risk
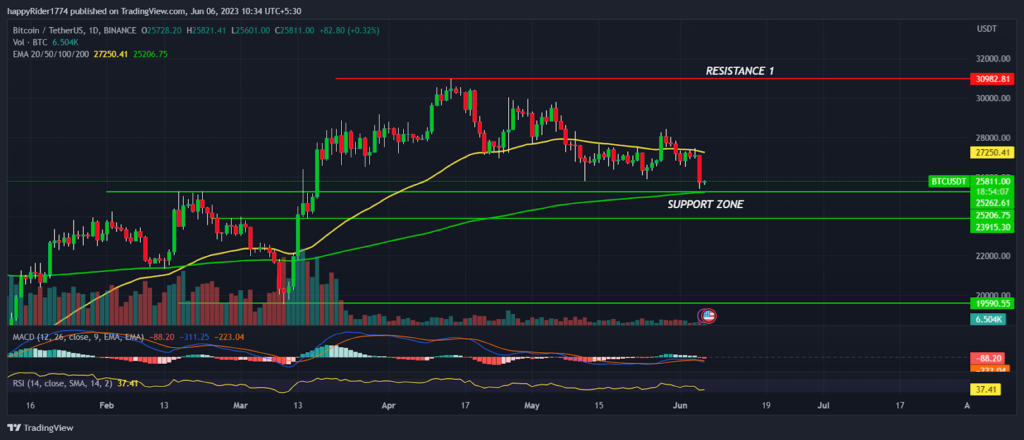
Bitcoin Price is still consolidating inside the range but sellers seem to be more active as compared to buyers. Short term bounce is not sustaining on higher levels which shows the strength of the bears.
However, Till BTC price holds the $25,200 support the possibility of bounce back is high. Well, the price action does not show any sign of reversal. Therefore, It’s better to wait and watch how the price reacts near to support before jumping into the trade.
If the sell off continues and BTC price slipped below $25,200 then we may see a sharp decline toward $24,000. On the other hand, if the price formed a Doji, Bullish hammer or bullish engulfing candle then it might be the signs of reversal.
BTC Price retraced 50% of the breakout
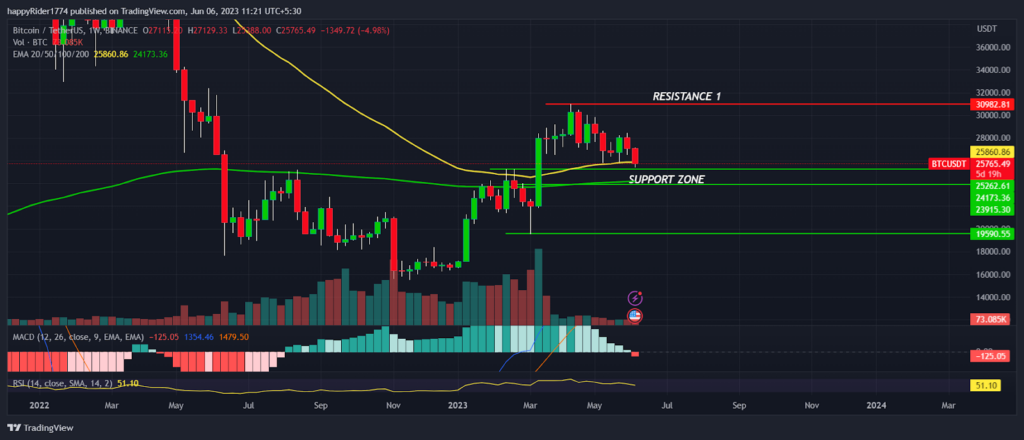
BTC Price is forming a bearish candle on the weekly time frame and trading near to the 20 week EMA. The price has retraced the 50% of the previous breakout that happened in march. Therefore, it will be not easy for the sellers to drag the prices further down.
The technical indicators like MACD had generated a negative crossover on a daily frame. It indicates bearishness and shows the signs of correction.
The RSI at 36 denotes weakness but near to the oversold territory. So, the short term pull back might trigger from the support marked in the chart.
Conclusion
Bitcoin Price fell 5% in a single day and gave up the $26K support. It negatively impacted the prices of many Altcoins. However, BTC price is near to the lower range of consolidation and till it holds $25,200 the possibility of reversal is high.
Technical levels
Resistance levels: $28,000 and $30,000
Support levels: $25,200 and $24,000
Disclaimer
The views and opinions stated by the author, or any people named in this article, are for informational purposes only. They do not establish financial, investment, or other advice. Investing in or trading crypto assets comes with a risk of financial loss.


