- In just 24 hours, the market cap of the BONK crypto has advanced by 12%.
- The crypto price is trading 39216% above its all-time low price.
BONK, created by Dexlab, is a community-focused cryptocurrency on Solana, emphasizing decentralization and community ownership.
Launched in 2017, it serves as a governance token, rewards active participants, and funds ecosystem development. BONK supports NFT enthusiasts, DeFi traders, and developers while enhancing multi-chain accessibility and blockchain gaming integration.


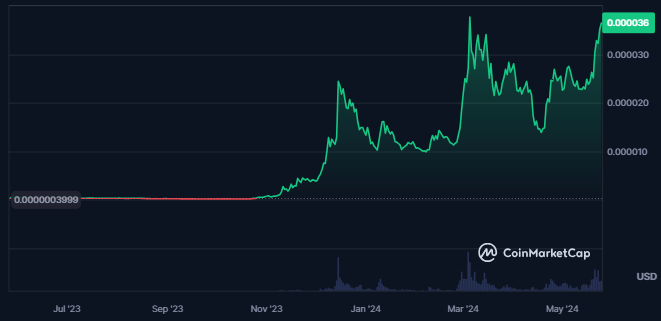
The price of the Bonk crypto is down by only 23% from its all-time high level of $0.00004704. The fear and greed index for the crypto is at 76, which indicates extreme greed among investors.
Also, the liquidity of the crypto price is huge, resulting in a volume/market cap of 25.47%. Also, the market cap value of the crypto is $2.455B and the market cap ranking of the crypto is #49 as per CoinMarketCap.
Bonk Crypto Derivatives Analysis
An equal amount of liquidations in Bonk Crypto on both sides can be seen, which shows that the crypto price has been struggling over the last 24 hours to move in either direction.
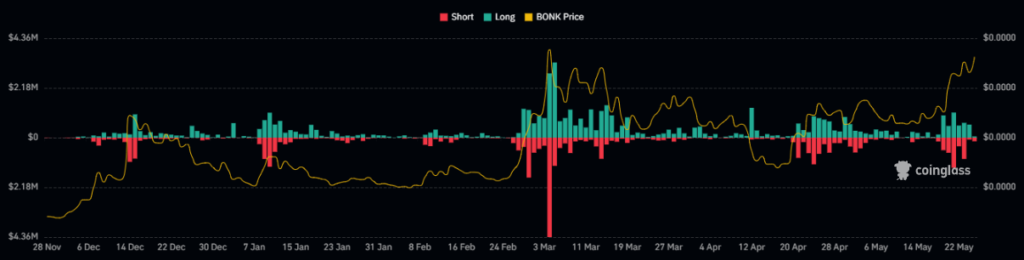
The value of the traded volume for the Bonk crypto has declined by 31% over the last 24 hours, while the open interest in the crypto has advanced by 13.6%.
Moreover, the recorded long liquidation for the crypto is worth $225.05K against the short liquidation of $231.73K. This shows uncertainty in the trading price of the crypto.
BONK Crypto Technical Analysis
The price of BONK cryptocurrency is demonstrating strong bullish momentum, advancing to higher levels.
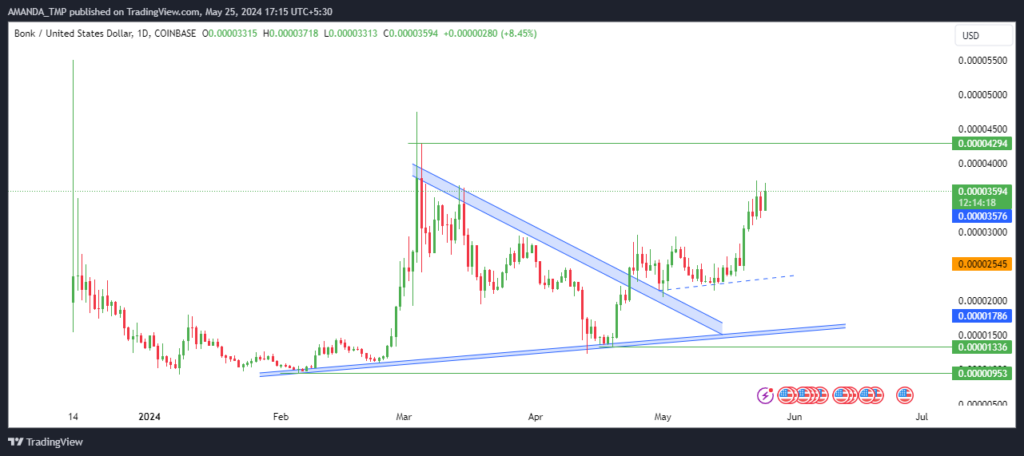
A recent breakout above the most recently formed inside candle bar on the daily chart underscored this upward movement, signaling a robust positive trend.
Additionally, the price action of BONK has led to the formation of a descending triangle pattern on the daily chart. BONK has successfully broken out above this pattern, further reinforcing the bullish outlook.
This breakout is a significant technical development, suggesting potential continued upward movement and increased investor confidence in BONK’s market performance.
BONK/USD Chart by TradingView
The price of BONK cryptocurrency is advancing to higher levels, supported by the 50-day Exponential Moving Average (EMA). Notably, the price has surged by 40% from the 50-day EMA, indicating strong momentum in the crypto’s price movement.
Technical indicators further affirm this bullish trend. The Moving Average Convergence Divergence (MACD) indicator is showing strength on the charts, signaling a buy. The MACD and the signal line are trading in a bullish cross, suggesting continued upward momentum.
Additionally, the Relative Strength Index (RSI) is climbing higher and has entered overbought zones. The RSI has also broken above the 14-day Simple Moving Average (SMA), reinforcing the strong bullish momentum in BONK’s price action.
Summary
BONK cryptocurrency shows strong bullish momentum, breaking above the inside candle bar and a descending triangle pattern.
Supported by a 40% surge from the 50-day EMA, positive MACD, and RSI indicators, BONK’s market cap rose 12% in 24 hours, with high liquidity and extreme investor greed indicating continued upward potential.
Disclaimer
This article is for informational purposes only and does not provide any financial, investment, or other advice. The author or any people mentioned in this article are not responsible for any financial loss that may occur from investing in or trading. Please do your research before making any financial decisions.


