
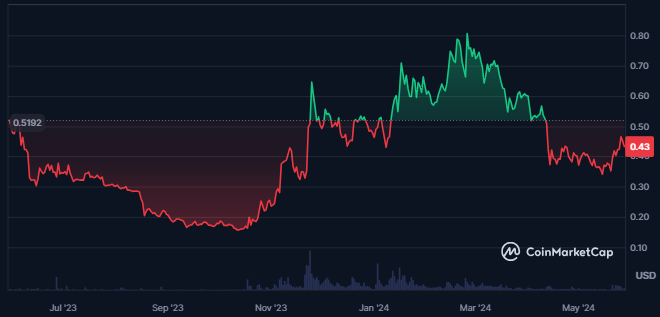
- The BLUR crypto price is down by 69% from its all-time high price.
- Blur has witnessed higher long liquidation in the last 24 hours.
Blur, launched in October 2022, is a zero-fee NFT marketplace for professional traders. Co-founded by Tieshun Roquerre and backed by Paradigm, it supports multi-platform NFT trading.
The $BLUR token, an ERC-20, governs marketplace protocols, lending, and ecosystem development through the Blur DAO’s community-driven governance.


Blur crypto’s sentiment is bearish, as per Coincodex, and the technical chart of the crypto also supports this. This crypto’s price volatility is high at 7.37%.
The Total Value Locked for the crypto has also surged over the last few days, resulting in $186.62M. The current value of the crypto market cap is $709.98M, and the annualized fees of the crypto is worth $13.31M.
What Do Derivatives Have for the Blur Crypto?
The derivatives trading volume for the Blur crypto has advanced by 20% over the last 24 hours, which shows a rise in traders’ activity in the crypto.
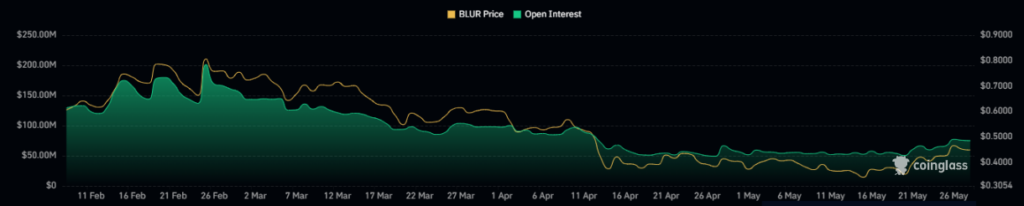
The volume has witnessed a surge, and its open interest has declined by 4.6% over the last 24 hours. That shows a decline in the open positions of derivatives in the crypto.
The current value of the open interest of the crypto as of press time is $70.7M. Moreover, the long liquidation of the crypto is worth $156.19K, whereas the short liquidation values only $11.23K.
BLUR Crypto Technical Analysis
The daily chart of the BLUR cryptocurrency reveals a consistent decline in price over the past three months, indicating a solid downtrend in its trading activity. Despite this ongoing weakness, a falling wedge pattern recently emerged on the daily chart.
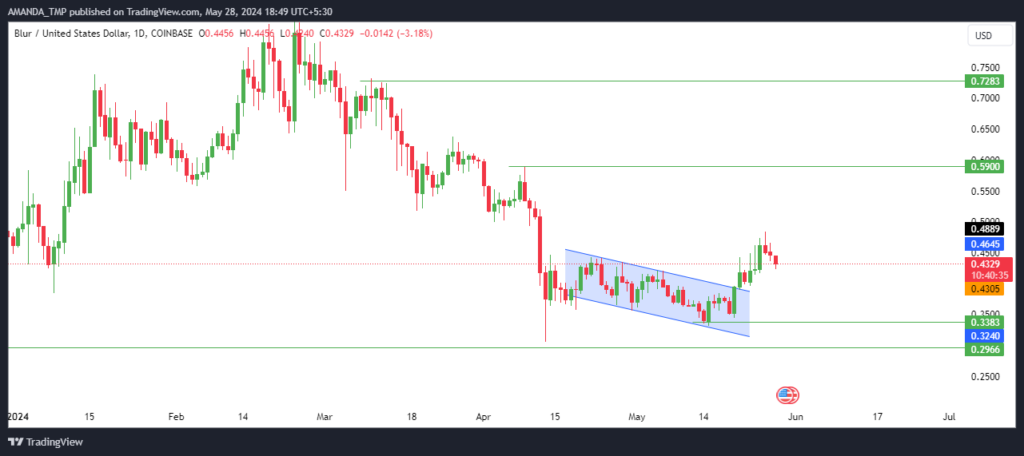
Following the formation of this bullish reversal pattern, the BLUR price broke out above the wedge. Currently, the price is pausing at the breakout levels, suggesting a potential shift in momentum as the market consolidates before its next move.
BLUR/USD Chart by TradingView
BLUR cryptocurrency’s price is currently trading below the 50-day and 200-day Exponential Moving Averages (EMAs), exhibiting a death crossover. This pattern indicates a strong downtrend in the cryptocurrency market.
The MACD indicator reveals uncertainty in BLUR’s trading price. While the MACD and the signal line are in a bullish crossover, they remain below the zero level, reflecting mixed signals in market momentum.
Conversely, the Relative Strength Index (RSI) has advanced above 50 and crossed the 14-day Simple Moving Average (SMA), suggesting an increase in momentum. This development indicates a potential positive move in BLUR’s price.
Summary
The BLUR crypto is down 69% from its all-time high, with higher long liquidations and mixed technical signals.
Despite a recent breakout from a falling wedge pattern, it remains below key EMAs. The MACD shows uncertainty, and the RSI indicates potential momentum, making future price movements uncertain.
If the trading price of the crypto continues to slip to lower levels, it might face support at the levels of $0.2960 and $0.330. The resistance levels are $0.590 and $0.720.
Disclaimer
This article is for informational purposes only and does not provide any financial, investment, or other advice. The author or any people mentioned in this article are not responsible for any financial loss that may occur from investing in or trading. Please do your research before making any financial decisions.


