
- The supply inflation of the Akash Network crypto is relatively very high.
- The price of AKT has high liquidity based on its market cap.
Akash Network, founded by Greg Osuri, is a decentralized cloud computing platform utilizing $AKT as its native utility token.
AKT facilitates staking, governance, payments, security, and incentivization within the network, offering an alternative to traditional cloud services by enabling users to rent or lease computing resources in a peer–to–peer marketplace.


The trading volume of the Akash Network crypto has declined by 18% over the last 24 hours from the press time. The market cap of the crypto has also declined by 6.4%.
Moreover, the value of the traded volume of the crypto in the last 24 hours is $58.423 Million which is 6.29% of the market cap of the crypto. This shows good liquidity in the crypto price and the market cap value of the crypto is $932.245 Million.
At press time, 61.82% of the maximum supply of the crypto is circulating in the market resulting in a circulating supply of 240.184M AKT. Also, the total supply of the crypto is similar to the circulating supply and the maximum supply of the crypto is 388.539M AKT.
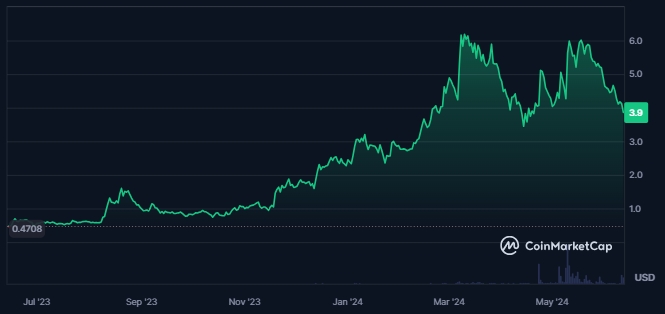
The fully diluted market cap of the crypto is $1.506 Billion and the price of the Akash Network has advanced by 2200% from its all-time low of $0.1672 which was recorded two years ago.
Also, the all-time high price recorded for the crypto is $8.08 and the current market price of the crypto at press time is down by 52.2%. Moreover, the all-time high was achieved three years ago in crypto.
AKT Crypto Technical Analysis
The price of AKT has broken below crucial levels and is in a strong downtrend for last few weeks.
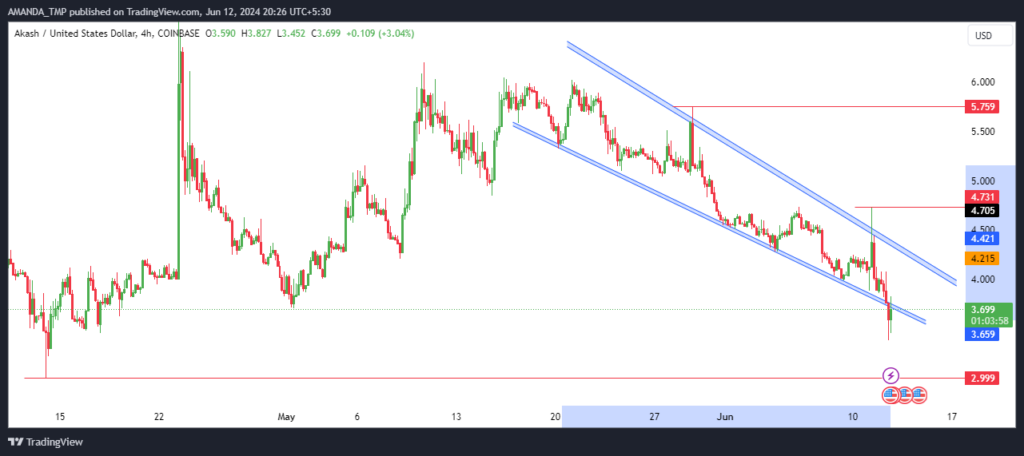
AKT is following a falling wedge pattern and has also broken down below the same with strong momentum. The candlestick formed on the chart also supports the bearish sentiment in the price of the crypto.
If we further look into the charts, strong lower lows and lower highs are formed on the charts which further confirms the downtrend in the price of the AKT crypto.
AKT/USD Chart by TradingView
The moving averages on the 4H chart of the crypto are trading in a death cross followed by a strong downtrend in the price of the crypto. The price of the crypto further is trading below the 50-day and the 200-day EMA.
The MACD and the signal line are trading in a death cross and have sustained in a negative trajectory. This is further followed by the formation of bearish histograms on the chart.
The RSI is following a bearish cycle and has been consistently trading below the 50 level. It has also slipped below the 14-day SMA which shows the dominance of sellers in the market.
Summary
Akash Network’s $AKT token is in a strong downtrend, breaking below crucial support levels with declining trading volume and market cap.
Technical indicators like a death cross in moving averages, bearish MACD histograms, and a low RSI signal ongoing seller dominance and further potential declines in AKT’s price.
If the price of AKT continues to decline, we might get to see the support levels of $2.5 and $3.0. Also, the resistance levels for AKT are $4.70 and $5.70.
Disclaimer
This article is for informational purposes only and does not provide any financial, investment, or other advice. The author or any people mentioned in this article are not responsible for any financial loss that may occur from investing in or trading. Please do your research before making any financial decisions.


