

- Polkadot has witnessed massive long liquidation in the last 24 hours.
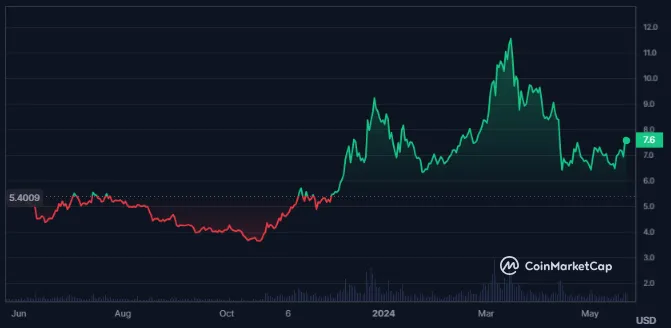
- The DOT Crypto price has increased 41% in the previous 1 year.
Polkadot, launched in 2020, is a blockchain network enabling user-created blockchains (parachains) connected to its main relay chain.
Its native token, DOT, is used for governance, staking, and securing parachain slots. Founded by Gavin Wood, Polkadot competes with networks like Ethereum and includes bridges for cross-chain interaction.


The price volatility of the Polkadot crypto is medium at 4.0%, and the market cap dominance is 0.29%.
Polkadot is the 13th largest cryptocurrency in the global crypto market, and its market cap value is $10.859B. Moreover, the value of the crypto’s traded volume has declined by 31% in the last 24 hours.
Polkaot Crypto Derivatives Analysis
Long liquidation worth $185.85K is recorded for Polkadot crypto in the last 24 hours from the press time. The short liquidation for the crypto further values $26.63K.
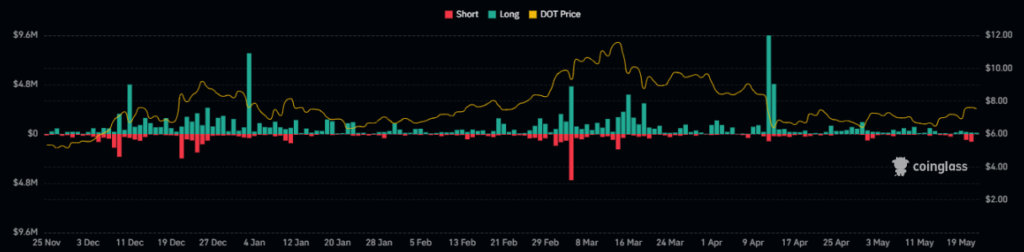
The value of the derivatives traded volume for the crypto has declined by 31.7%, resulting in $266.48M in the last 24 hours. Following this, the open interest has also decreased by 1.08%.
DOT Crypto Technical Analysis
The price of DOT cryptocurrency had been trading within a falling wedge pattern for an extended period.
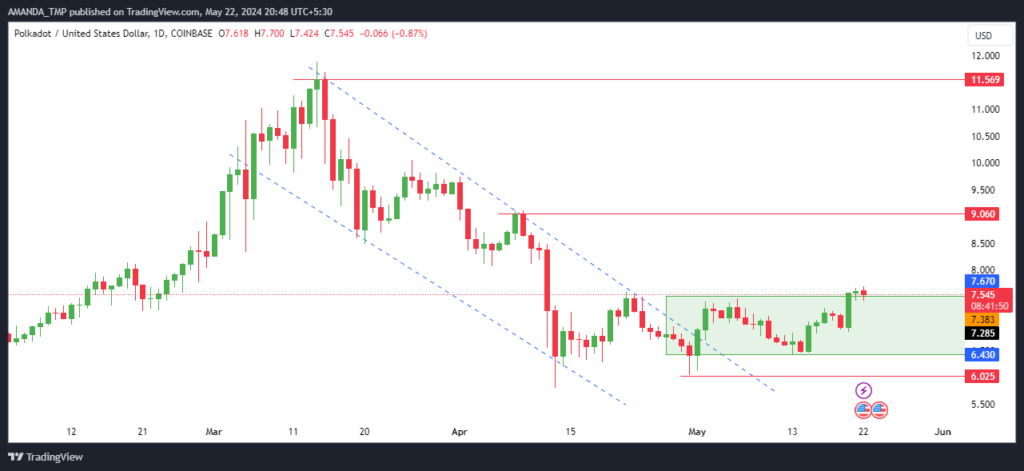
On May 1, 2024, the DOT price successfully broke out above this pattern. Since the breakout, the price has sustained itself above the breakout level.
As of the current market analysis, DOT’s price action indicates a consolidation phase within a narrow range. The upper limit of this consolidation is set at $7.5. Should the price break above this level, it could signal the potential for a continued upward surge.
DOT/USD Chart by TradingView
The 20-day and 200-day Exponential Moving Averages (EMAs) currently exhibit a death crossover, indicating a bearish trend. Despite this, the cryptocurrency’s price action is bullish, moving towards the 200-day EMA. A continued price rise could potentially lead to a golden cross, signaling a bullish reversal.
The Moving Average Convergence Divergence (MACD) metrics are also trending positively. A recent bullish cross between the MACD and the signal line supports this upward trajectory, suggesting increasing bullish momentum.
Additionally, the Relative Strength Index (RSI) has crossed above the 14-day Simple Moving Average (SMA) and the 50 level, further confirming the bullish momentum in the cryptocurrency’s trading price.
Summary
The Polkadot (DOT) crypto price has surged 41% over the past year. Recently, breaking out of a falling wedge pattern, the price has led towards higher levels.
Despite a death cross in the EMAs, bullish indicators like the MACD crossover and the RSI above the 50 level suggest the potential for continued upward momentum.
The support levels of the DOT crypto are at the level of $4.8 and $6.0. The resistance levels are $9.0 and $11.50.
Disclaimer
This article is for informational purposes only and does not provide any financial, investment, or other advice. The author or any people mentioned in this article are not responsible for any financial loss that may occur from investing in or trading. Please do your research before making any financial decisions.


