
 Pearl
Pearl NEAR Protocol
 Bitway
 Starknet
 Walrus
 Pudgy Penguins
 Hyperliquid
- The price of the DOT crypto has increased by 21% in the last 1 year.
- Polkadot has given a positive performance as compared to its token sale price.
Polkadot is a unique blockchain network that enables users to create their own blockchains atop its main chain, the relay chain.
These user-created blockchains, or parachains, benefit from shared security and customizable features. DOT, Polkadot‘s native token, is used for governance, staking, and bonding parachains.
Founded by Gavin Wood in 2016, Polkadot offers a sandbox for experimentation via the Kusama network.
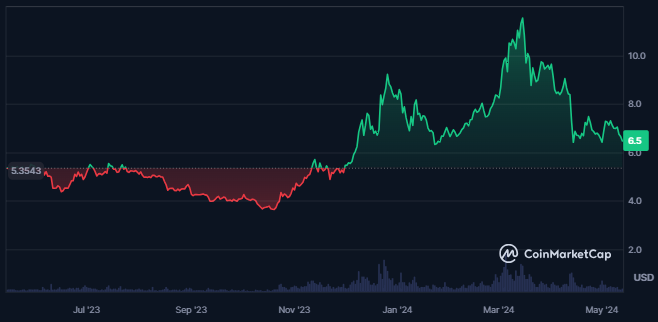
The Polkadot crypto has very low liquidity as the volume/market cap ratio of the crypto is 1.27%. Additionally, the circulating and total supply of the crypto are the same.
The market cap of the Polkadot has declined in the last 24 hours from the time of writing, while the trading volume of the crypto has advanced. That shows the strength of the declining momentum of crypto.
Polkadot is the 14th largest cryptocurrency in the global crypto market. Also, the market cap value of the crypto is $9.32B. The value of the traded volume for the crypto in the last 24 hours is $122.843M.
It has infinite maximum supply, and the total supply of the crypto is 1.437B DOT. The crypto’s price traded 141% above its all-time low at press time. Moreover, the achieved all-time high price of the crypto is $2.69.
When writing, the price volatility of the Polkadot crypto was medium at 3.83%, while the fear and greed index showed greed among the investors. Additionally, the market cap dominance of the crypto was 0.28%.
Polkadot Crypto Derivatives Data Analysis
The value of the derivatives trading volume of the crypto advanced by 23.9% in the last 24 hours. It shows an advance in the crypto’s trading activity.

Despite the surge in volume, the open interest of the Polkadot has declined by 1.2%, resulting in $243.20M. Additionally, the long/short ratio for the crypto is 0.8832.
The long liquidation of the Polkadot crypto is much higher than the short liquidation, which results in $658.86K, while the short liquidation of the crypto is just $12.15K.
DOT Crypto Technical Analysis
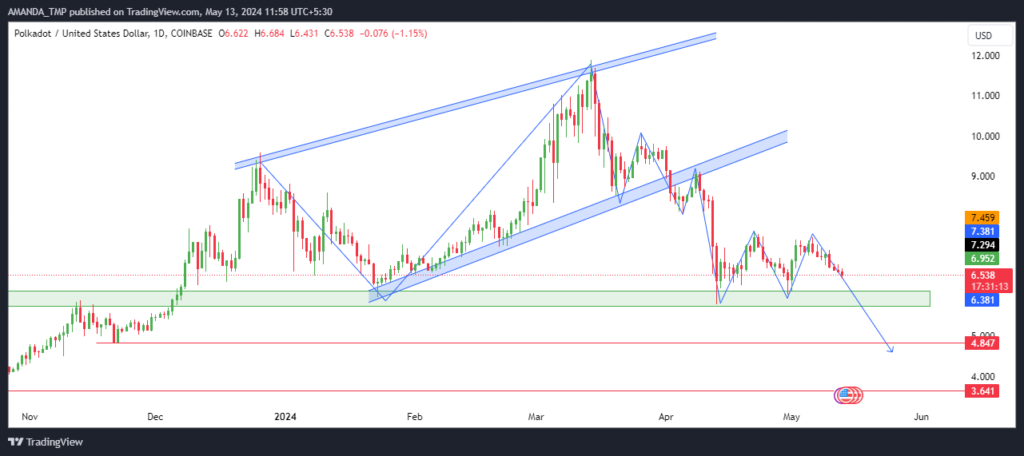
In early May 2024, the crypto price showed mixed bearish and bullish price action. It has experienced a short-term uptrend followed by a major downtrend in the price of DOT crypto.
The price of the DOT crypto has declined below a rising wedge pattern and is currently trading in a range-bound zone. A further decline might be seen if the price breaks below the consolidation zone.
DOT/USD Chart by TradingView
The crypto price has declined below the crucial EMAs plotted on the daily crypto chart. It suggests a bearish trend following which the 20 and 200-day EMAs have formed a death cross.
The MACD metrics overlap each other on the chart, indicating volatility in the price of the crypto.
The RSI is also sustaining below the 50-level and has declined below the 14-day SMA, which shows weakness in the momentum of the crypto.
Summary
DOT crypto is facing a bearish outlook as it navigates a mixed trend, with recent declines below key moving averages.
Despite increased trading volume, open interest has dropped, signaling waning investor confidence. Technical indicators such as the MACD and RSI reflect volatility and weakening momentum, suggesting a potential further decline.
The support levels of the DOT crypto are $3.60 and $4.80, while on the higher side, sellers might try to push the price to lower levels from $9.0 to $11.50.
Disclaimer
This article is for informational purposes only and does not provide any financial, investment, or other advice. The author or any people mentioned in this article are not responsible for any financial loss that may occur from investing in or trading. Please do your research before making any financial decisions.




