

- OMG Coin is approaching the pivot of a symmetrical triangle on daily charts
- OMG coin has previously given a breakdown from a symmetrical triangle
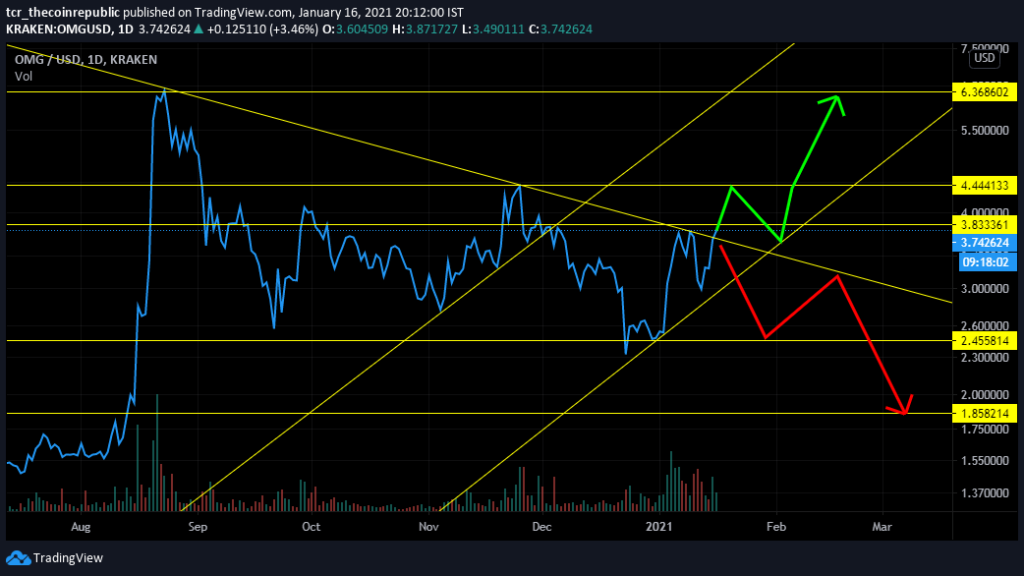
OMG Coin prices have approached the pivot of a symmetrical triangle where a long term support line and short term support line are approaching. The coin has already given a breakdown once and tested its immediate support of $2.422. A breakdown from the current triangle can launch the coin towards the resistance of $4.15 to $4.44. In contrast to the above, a breakdown will make the coin test the support of $2.45 and $2.00. The 24 hour volume and market cap are $200,258,375 and $521,245,822 respectively.
OMG Coin Price Has Reached To A T-Junction, Will It Fly High Or Crash Like Last Time?
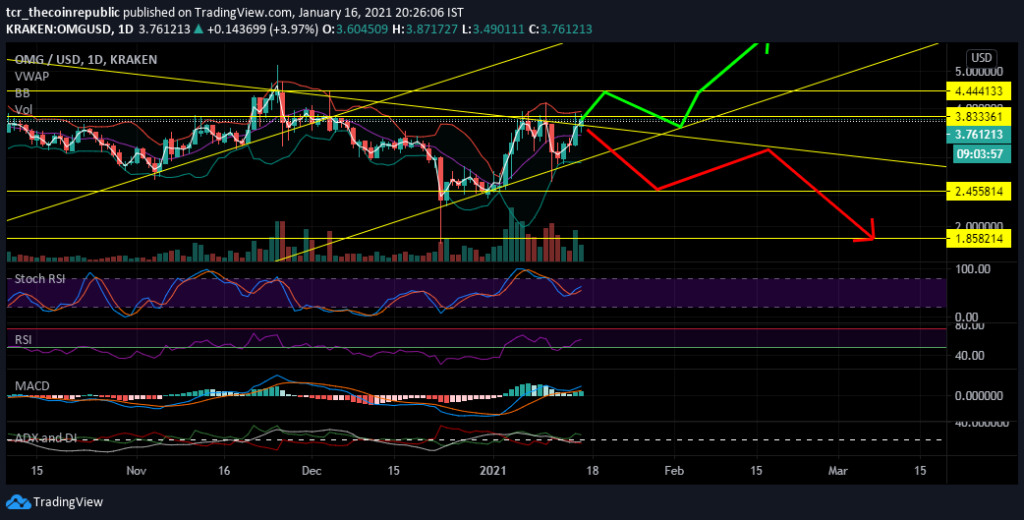
OMG Coin prices which declined because of a triangle breakdown few days back, has approached another intersection of resistance and support. Today’sToday’s candle indicates a fresh buying pressure that pushed the coin above the resistance, indicating a bull run’s potential onset. However, there is another horizontal pressure existing at $3.833 levels.


The volume has increased from the past two sessions, pointing out that new traders are entering the market.
The VWAP is acting as a support at $3.704 levels.
The stochastic has flashed buy signal by giving a bearish crossover in today’s session. The indicator’s lines are still in the neutral zone; it will be early to conclude that the bulls have taken over the rally. The coin must sustain and retest the resistance to confirm a breakout.
The Relative Strength Indicator is at 61.27 levels, which can be interpreted as a more muscular upward strength than previous days. The strength line can get resistance between 70-74 levels.
The MACD(8,21,5) lines have surpassed 0 levels after ascending from the negative territory and retesting 0 levels; this is a bull rally sign. The MACD line has taken support from the slow line for confirming a bull rally.
The ADX lines are indecisive towards the strength of the trend as ADX line, ADX+ line, and ADX- lines are at 15.78, 25.58, and 17.5, indicating weak strength in the trend be interpreted as a better buying pressure than the selling pressure. However, one should wait for either of the lines to cross 28 levels to confirm the rally’s direction, which often brings reversals.
Conclusion
OMG Coin prices are sustaining at an intersection point of a longer-term resistance and shorter-term support. It seems that the coin approached the resistance, but the bear came in action post rejection from the resistance of $3.833 and made a spinning top candle on the charts.
Support: $3.707(VWAP), $3.42(BB Base) and $2.9-$2.91(Lower BB)
Resistance: $3.91-$4.00(Resistance zone)


