

- BNB Price is currently on a consolidated move with a gain of 1.47% in an intraday session. In contrast BNB/BTC pair is also seeing a bearish move
- Technical Indicators for BNB price suggests a halt from bullish momentum. In contrast, Binance Price has gain of more than 200% from the start of this year
Binance is one of the biggest crypto exchanges globally. It was launched in 2017 with an aim to bring Crypto currencies in forefront. BNB price has seen a significant gain in the past.This gains could continue in the future.
Binance is currently ranked 3rd with a market capitalization of $96,408,157,822.35. The coin volume has seen a decrease of 27%.The volume to market capitalization ratio for BNB is 0.0517, and if it crosses above 0.8, then a huge buying rush can be seen.


Technical Indicators Suggest A Bullish Move For BNB Price
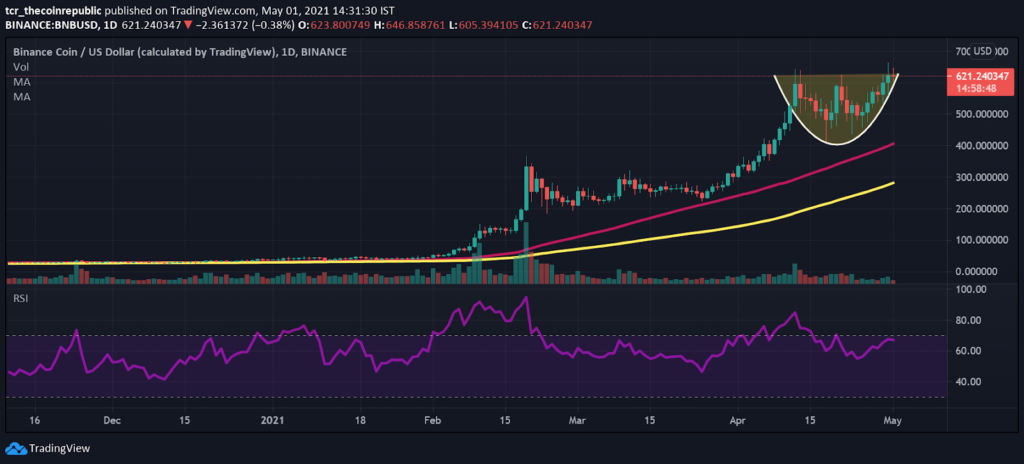
The weekly technical chart of Binance coin highlights a bearish move. BNB price has made a double top formation in the daily chart. Resistance on the upside for BNB can be seen at $700. It can bounce back while going down from $550. It is trading above 50 and 100 Moving Average. The 50MA (Red) line is at $413, making it temporary support for the price. The coin has formed a double top semi arc formation in the daily chart. If the price breaks 15% above the zone then a strong bullish momentum can be seen. One can expect a strong momentum in upcoming days.
RSI(Bullish): It is trailing at 68.23, showcasing its presence in the overbought zone. There is a positive slope formation in the RSI, highlighting a positive sentiment for the price.The RSI depicts a bullish momentum for BNB.
Conclusion
BinanceCoin price has seen a gain of more than 200% from the start of the year.BNB/BTC pair can also accompany the upcoming gains in the future. An investor should do their due diligence before investing.
Technical Levels
Major Support:$550
Major Resistance:$700


