

- BTT token price action is holding the support at $0.003764 on the intraday trading session
- The 24-hour trading volume in BTT is at $459.24 Million
- The BTT/BTC pair was trading at 0.00000010 BTC with a loss of 2.44%
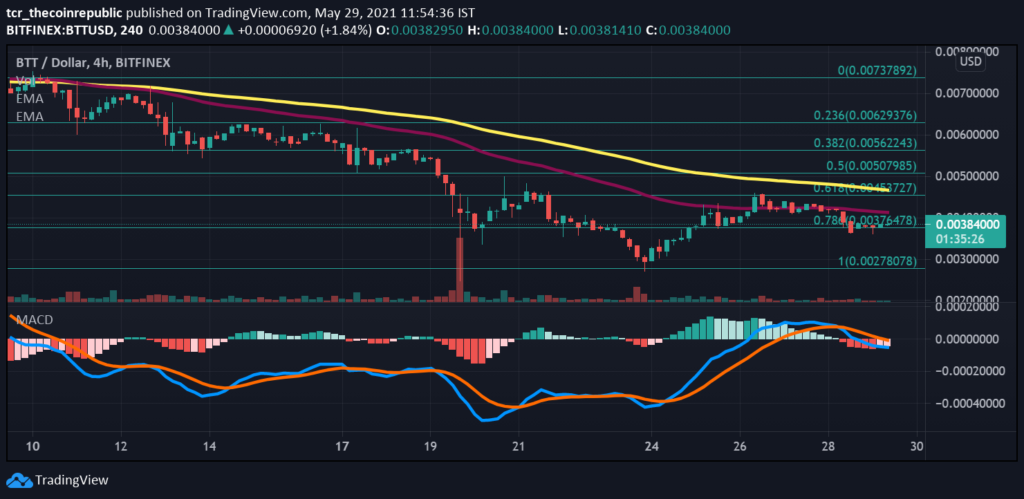
The 4-hour technical chart of the BTT token projects a bearish trend with a weakness in price action. According to Fibonacci retracement, BTT’s critical support level is placed at $0.002780. Whereas if it heads up, the fundamental resistance level to watch is $0.005622. While diving into the monthly chart of a 4-hour time frame shows a Doji candle representing both buyers and sellers failed to gain control over the coin price movement.
EMA- (50,100) acts as another unbroken support in the coin. EMA-50 (yellow) moves below EMA-100 (red), which presents a downtrend. Investors may also perceive the price below the EMA-100 (red); hence, the price will follow the negative trend.


MACD indicator (BEARISH) crossover beneath the signal line indicates a sell signal in the coin. Moreover, Investors can see red bars in the Histogram index, which resulted in the drop of price action.
The volume of (412K) is below the Volume MA (655K) of 20-days. Can observe tiny red volume bars below volume ma of 20-days to pull down the price. High buying pressure is required in BitTorrent to drive its price to higher levels.
BTT Token Price Movement Shows Weakness Above Support
BTT token price traded at $0.003840 with a loss of 3.1% in the last 24-hour and a -9.7% loss weekly. Furthermore, the BTT price is in a downtrend and testing the support of $0.003764. In contrast, market capitalization stands at $2.49 billion. Technically, investors can perceive EMA-50 moves below EMA-100, and the price is below the 100-EMA. MACD index showcases a negative crossover. Besides, low selling volume has been directed in the coin. Moreover, the price move can be towards the support of $0.002780 in future trading sessions.
Resistance: $0.005622
Support: $0.002780


