

- IOTA token price action forming a cup and handle pattern on the intraday trading session
- The 24-hour trading volume in IOTA is at $62.34 Million
- The IOTA/BTC pair was trading at 0.00003152 BTC with a gain of 3.40%
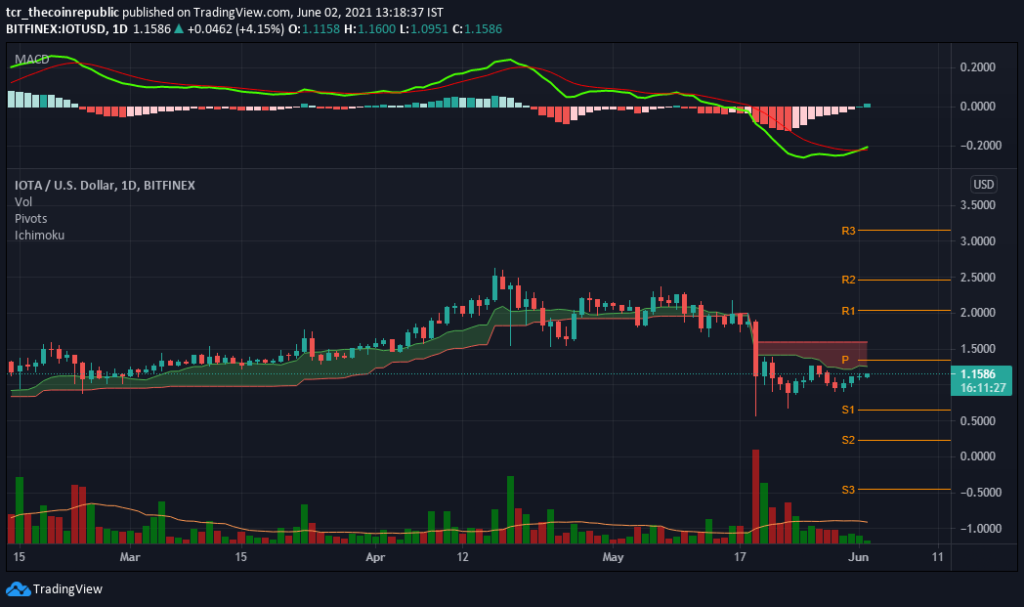
The daily technical chart of the IOTA token presents the price forming a cup and handle pattern below the pivot levels. According to pivot points, the IOTA critical support level is $0.65. Whereas if it travels up, the initial resistance level to watch is $1.35. The chart presents a Doji star candlestick pattern representing that both buyers and sellers could not gain control over the coin.
The MACD indicator gave (BULLISH) crossover above the signal line, showcasing the beginning of a bullish movement. Investors may see emerging green bars on the histogram index.

The Ichimoku Cloud, consisting of lead 1 & lead 2 with a displacement value of 1. It acts as a pivot level and a leading indicator in the asset price change. Investors may witness the price break below the green Moku Cloud and now float below the red Moku Cloud, so until the price resides below the red Moku Cloud, it will assure a bearish trend in IOTA.
The volume of (1.02M) is underneath the Volume MA (8.04M) of 20-days. A slight increase in buying pressure can be seen in IOTA to pull up the price.
IOTA Token A Slow Mover For Your Long Term Portfolio
IOTA token price traded at $1.15 with a gain of 6% daily and 8.8% returns in a week. Moreover, IOTA price action forms a cup and handles patterns below the pivot points. In contrast, market capitalization stands at $3.27 billion. Technically, investors can perceive strength, but the price is below the red Moku Cloud. MACD gives a bullish crossover today. Volume is low below the MA of 20 days. Additionally, the price move can be towards the resistance of $1.35 in the upcoming days.
Resistance: $1.35
Support: $0.65


