

- CEL token is at a neutral of 0.6% during the intraday trading session.
- The 24-hour trading volume is at $20 million.
- CEL/BTC pair is trading positive by 4.5% at 0.00013639 BTC.
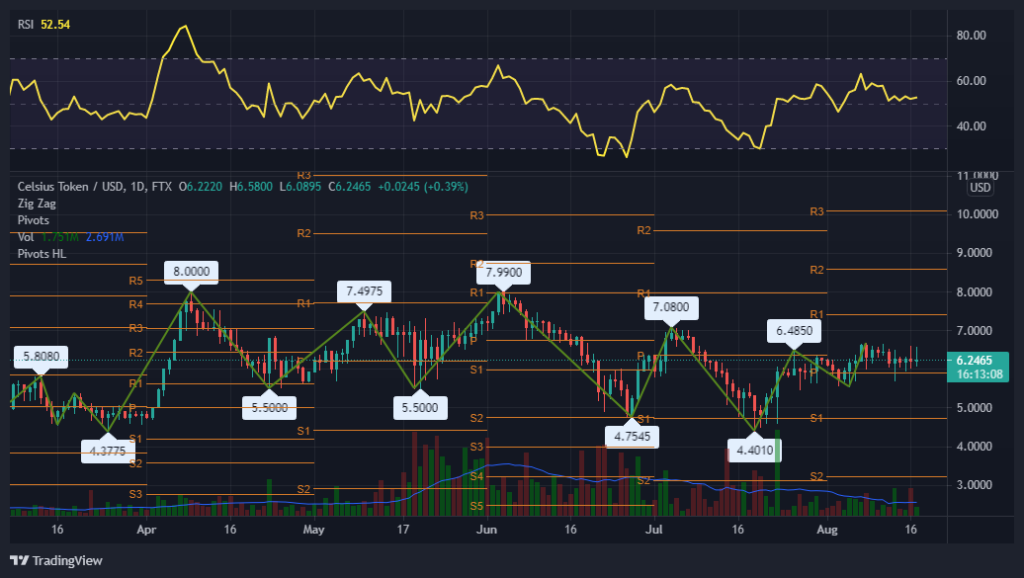
The daily technical chart of the CEL token displays a sideways trend. According to the pivot levels, the primary support level is $5.90. On the other side, if it rushes up, the resistance level to follow is $7.40. Although the chart forms a spinning top candlestick pattern within the day, it is predicted that the price may remain sideways with high reliability.
The Zig-Zag framed a top of $8.0 on Apr 09. After that, investors can notice a massive correction of 45%, all the way low to $4.40. Now price levels are back around the range of $6 this week.


The volume of (1.752M) is close to the MA of 20-days (2.691M). As a result, the volume is moderate, resulting in its price moving around the pivot zone. Investors may also mark that the volume bars on the chart are declining, which intimates that notable volatility is expected in the upcoming trading session.
The RSI indicator gave a (neutral) signal with 52, projecting a sideways trend in the coin. Investors may observe a flat slope in the index. It may surge in future trading sessions.
Celsius Network (CEL) Token Requires High Volume
The price of Celsius Network today is US$6.23, and the 24-hour trading volume is US$20,793,124. CEL prices have increased by 0.8% in the past 24 hours. There are 420 million CEL coins in circulation, with a total of 696 million. The RSI indicator shows a neutral signal, and the traders have guided moderate volume. Technically, the price moves around the pivot and remains in a sideways trend. Therefore, as with overall market sentiment, the trend remains neutral.
Resistance Level: $7.40
Support Level: $5.90


