

- Siacoin price is in an uptrend at 10.01% during the intraday trading session.
- The 24-hour trading volume is at $61 million.
- SC/BTC pair is trading positive by 3.8% at 0.00000040 BTC.
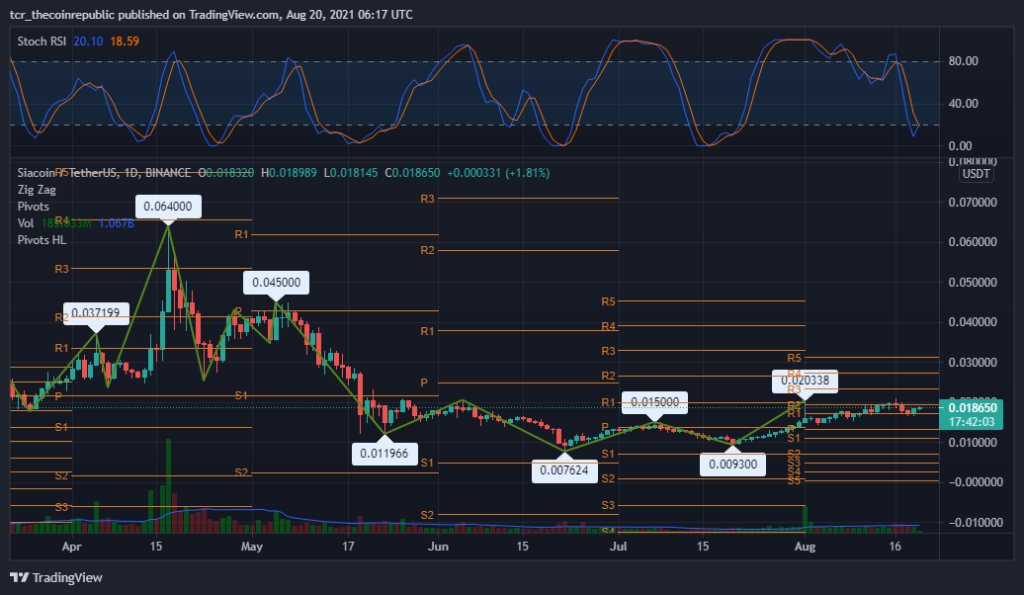
The daily technical chart of Siacoin price action displays an uptrend. According to the pivot levels, the primary support level is $0.0171. On the other side, if it rushes up, the resistance level to follow is $0.0233. Although the chart forms a bullish harami candlestick pattern within the day, it is predicted that the price may remain upwards with medium reliability.
The Zig-Zag framed a top of $0.0640 on Apr 17. After that, investors can notice a massive correction of 85%, all the way low to $0.0076. Now price levels are back around the range of $0.018 this week.


The volume of (232.687M) is below the MA of 20-days (1.07B). As a result, the volume is low, causing its price to move around the resistance zone. Investors may also mark that the volume bars on the chart are inclining, which intimates that notable volatility is expected in the upcoming trading session.
The Stochastic RSI (bearish) with a value of K-19 D-18 presents a sell signal in the coin. Investors may observe an inclining slant and a positive crossover in the index. It may remain in positive territory for future trading sessions.
Siacoin Price Action Bullish Reversal Incoming
The price of Siacoin today is 0.01874700 USD, and the 24-hour trading volume is 61,204,103 USD. The price of SC has increased by 10.1% in the past 24 hours. Its circulation is 49 billion SC coins, and the total amount is unknown. The Stochastic RSI indicator shows a sell signal, and the traders have guided low volume. Technically, the price moves around the resistance and remains in an uptrend. Therefore, as with overall market sentiment, the trend remains bullish.
Resistance Level: $0.0233
Support Level: $0.0171


