
- ONE crypto is in an uptrend at 1.3% during the intraday trading session.
- The 24-hour trading volume is at $116 million.
- ONE/BTC pair is trading negative by -0.9% at 0.00000244 BTC
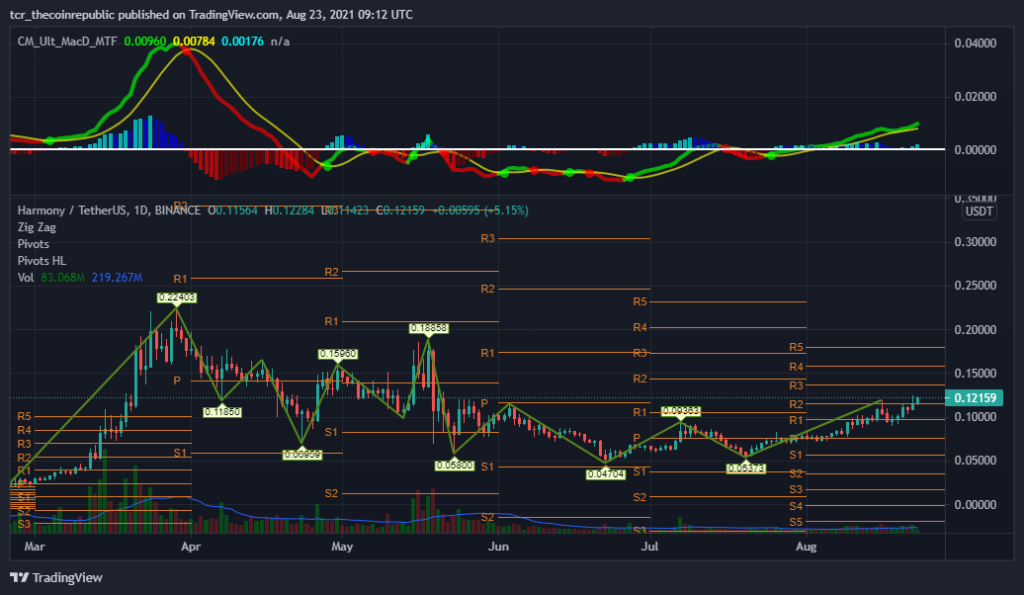
The daily technical chart of ONE crypto price action displays an uptrend. According to the pivot levels, the primary support level is $0.1150. On the other side, if it rushes up, the resistance level to follow is $0.1368. Although the chart forms a bullish harami candlestick pattern within the day, it is predicted that the price may remain upwards with medium reliability.
The Zig-Zag framed a top of $0.22 on Mar 29. After that, investors can notice a massive correction of 80%, all the way low to $0.04. Now price levels are back around the range of $0.12 this week.


The volume of (83.227M) is below the MA of 20-days (219.275M). As a result, the volume is average, causing its price to break above the resistance zone. Investors may also mark that the volume bars on the chart are inclining, which intimates that notable volatility is expected in the upcoming trading session.
The MACD indicator gives (bullish) crossover above the signal line on Jul 25, indicating a buy signal in the coin. Moreover, Investors can see blue bars in the Histogram index.
Harmony ONE Crypto Moves Within Rising Channel Pattern
Harmony’s price today is $0.122194, and the 24-hour trading volume is $116,772,840. Prices have risen by 1.3% in the past 24 hours. Its circulation is 10 billion ONE coins, and the total amount is unknown. The MACD indicator shows a buy signal, and the traders have a guided average volume. Technically, the price breaks the resistance and remains in an uptrend. Therefore, as with overall market sentiment, the trend remains bullish.
Resistance Level: $0.1368
Support Level: $0.1150


