

- The ZEN token price action represents an uptrend with solid bullish momentum.
- ZEN has risen above the 50 and 200 EMA, projecting bullishness.
- The pair of ZEN/BTC trades at 0.001733 BTC, with an intraday gain of +8.32%.
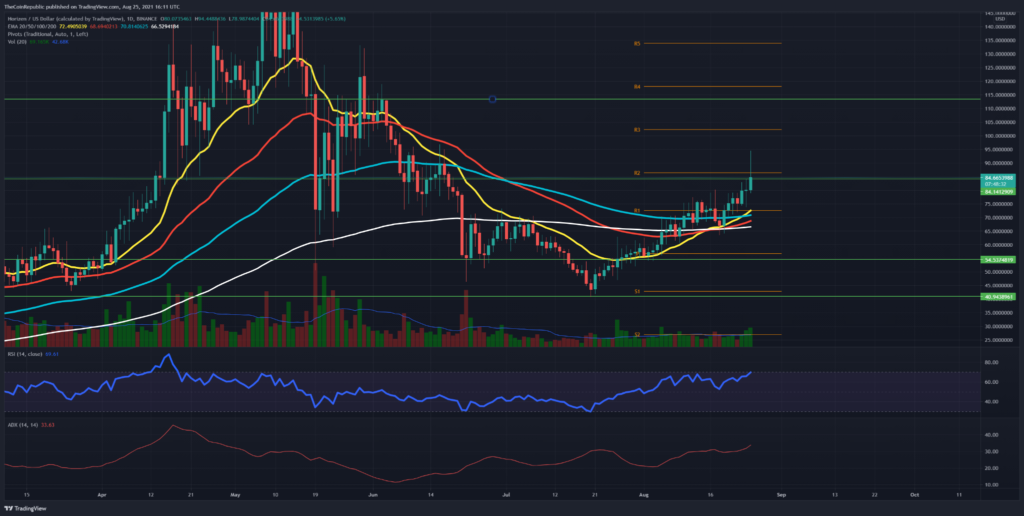
The ZEN token price trend higher under the influence of a solid demand-backed uptrend in the daily technical chart. It has managed to rise above the horizontal resistance level of $85 as the uptrend has solid bullish momentum.


The recent jump in ZEN token price is of more than 30% within the past week after finding demand near the 200-day EMA with a complete double bottom pattern.
Presently, the ZEN coin price is trading at $87.29, with a gain of 16.58% in the market cap in the last 24 hours. Furthermore, the intraday trading volume in the ZEN chart has suddenly increased to +133% as the buying pressure increases. As a result, the coin may soon rise above the $100 mark.
Increasing Volumes Increase Volatility In ZEN Price
As per the price action, the coin may struggle near $90 after a bullish breakthrough. On the other hand, a breakout above this hurdle could drive ZEN to the $100 mark. However, in case of a reversal, $70 and $54 stand to support falling prices.
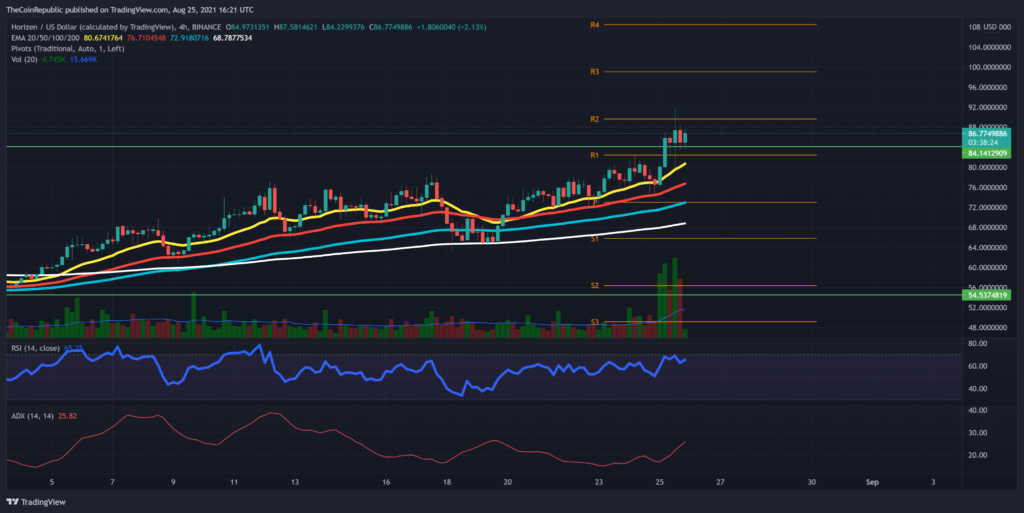
Reliable support for a bearish move can be found in the rising 20/50/100/200 EMAs on the 4-hour chart. The token price, however, is above 200 EMA, indicating an uptrend trend.
RSI indicates a rise of underlying bullishness when its slope moves higher towards the overbought area.
Since the ADX line keeps moving higher, it is a sign of a growing trend.
Conclusion – ZEN token price struggles to sustain above the $85 level, and the resistance from $90 projects a high probability of a reversal. Therefore, investors should wait for a credible entry point that may arise upon a retest of the bullish breakthrough. Otherwise, the reversal may act as an exit signal for investors to book their profits.
Support– $70 and $54
Resistance– $90 and $100


