

- The Shiba Inu token is increasing upwardly, around 18.2%, during the intraday trading session.
- The 24-hour trading volume is at $987 million.
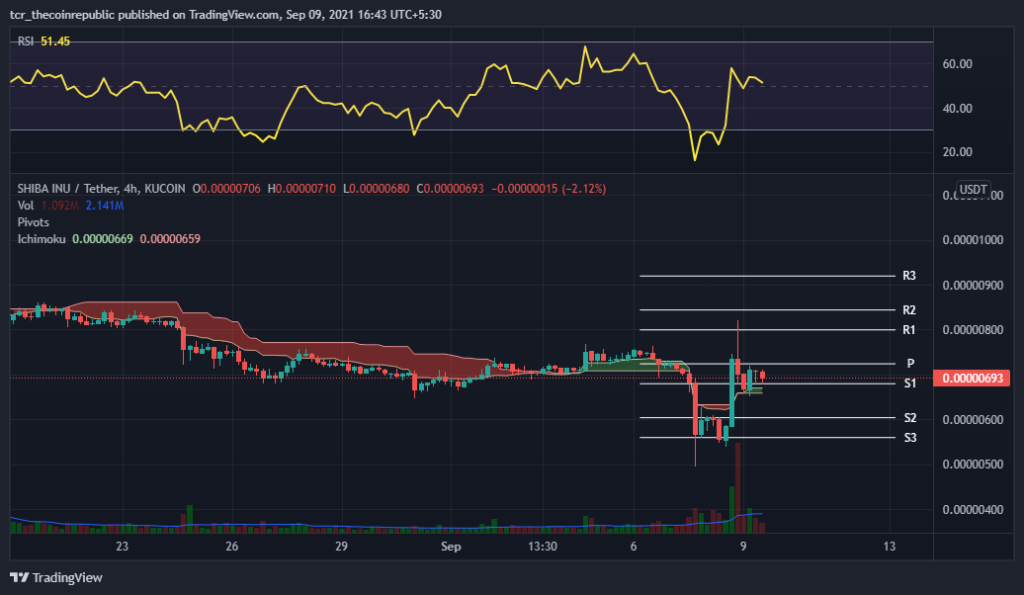
Daily technical chart and Shiba Inu token are showing an upward trend. Based on the pivot level, the initial support level is 0.00000560 USD. From another perspective, if it accelerates, the resistance level to watch is 0.00000800 USD. Although the chart created a bearish harami candlestick pattern during the day, the price is expected to be downwards with medium reliability.
Ichimoku Cloud is composed of lead-1 and lead-2, and the displacement value is 1. It operates as a pivot level and leading indicator of asset price changes. Investors can see that the price breaks above the Red Moku Cloud and now trades above the Green Moku Cloud, so the cost is above the Green Moku Cloud, ensuring the positive trend of SHIB.


Trading volume (1.133 M) is below the 20-day moving average (2.134 M). In short, the moderate volume of transactions caused the price to bounce back from the support zone. Investors may also notice that the volume bar on the chart is declining, which indicates that surprising volatility is expected in the next trading days.
The RSI indicator gave a (neutral) signal with 52, projecting a cold signal in the coin. Investors may observe a flat slope. It may plunge in future trading sessions.
Shiba Inu Token Oscillators Are Signalling Cold
Shiba Inu’s price today is 0.00000694 US dollars, and the 24-hour trading volume is 987,511,569 US dollars. The price of SHIB has increased by 18.1% in the past 24 hours. It has 500 trillion SHIB coins, totaling 1 quadrillion. The RSI indicator shows a neutral sign, and the traders have led to moderate volume. Technically, the price resides around the support zones and continues in a neutral trend. Accordingly, as with the overall market viewpoint, the trend remains bearish for upcoming trading sessions.
Resistance Level: $0.00000560
Support Level: $0.00000800


