

- The RSI shows a significant bearish divergence to the ATOM coin’s price action
- The ATOM/BTC pairing traded at 0.000006411 BTC, with again 11.79 %
- The 24hr trading volume in ATOM coin is $2.71 Billion
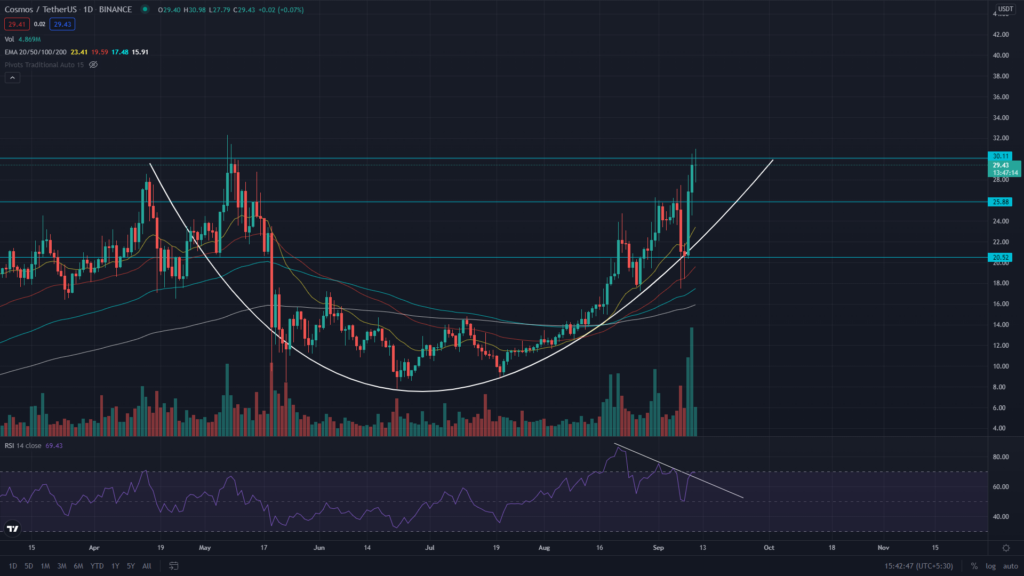
The ATOM coin indicates the formation of a rounded Bottom pattern in the daily timeframe. The key resistance level(neckline) for this pattern is situated at the $30 mark, which the price is currently trying to break through. If the coin manages to provide a proper breakout from this neckline, the ATOM traders can grab an excellent long opportunity in this coin.
According to the EMA’s, the ATOM coin has a strong bullish trend with its price trading higher than the 20, 50, 100 and 200 EMA. Moreover, the 20 EMA provided strong dynamic support to the coin’s price.


The RSI value (BULLISH) is at 68, indicating a strong bullish trend in this coin. However, the RSI line shows substantial bearish divergence concerning the coin’s price, suggesting weakness in the bullish momentum.
ATOM coin shows the probability of forming a cup and handle pattern
The ATOM coin indicates strong rejection from the $30 mark, with several higher price rejection candles indicating a chance of price reversal. However, even if the price gave a minor retracement, there were many cases where the rounding bottom pattern turned out to be Cup and Handle pattern. Thus, the long traders should have this coin on their watchlist, so they don’t miss out on a fantastic opportunity in this coin.
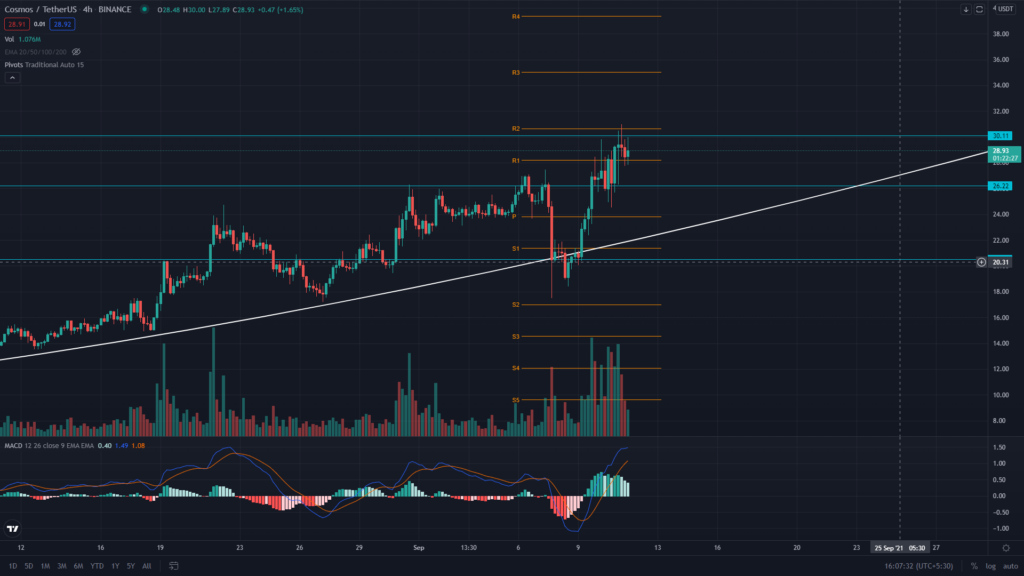
The Moving average convergence divergence indicator (BULLISH) shows it’s both MACD and signal lines are moving above the neutral area (0.00), indicating bullish momentum in the ATOM coin.
Conclusion: The technical perspective for ATOM looks quite bullish. The coin travels in a decent uptrend and displays an excellent long opportunity for Crypto traders with a rounding bottom pattern. If the price manages to give a decisive breakout and sustain above the $30 resistance, the traders can expect a 1-2 pivots levels target.
Support – $36.2
Resistance: $30


