

- XEC coin price action projects a minor retracement phase in its chart
- The 20 EMA provides support to the rising prices in the 4hr time frame chart
- The pair XEC/BTC is trading at 0.00006022 BTC with an intraday loss of -13.94%.
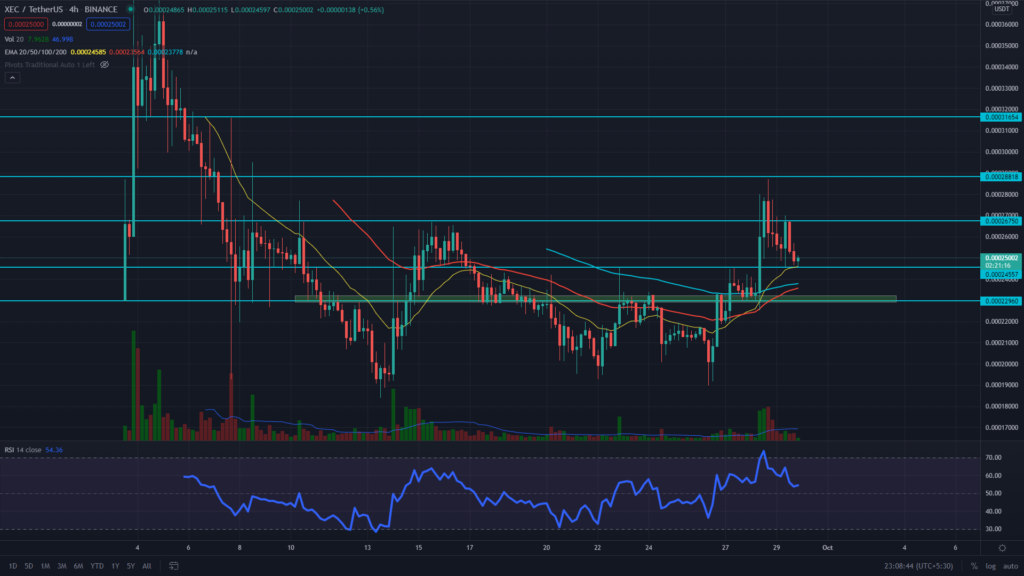
The XEC coin price action has displayed a remarkable rally with long bullish engulfing candlesticks in the 4hr technical chart, indicating increased buying pressure. Furthermore, the price is currently in a retracement phase, where the volume activity has declined significantly.


The decrease in trading volume is usual in such short pullbacks, which indicates the interests of market participants in a bull run. In addition, the daily EMAs rise higher in a bullish alignment, projecting a bullish rally.
The XEC coin price trades at $0.000247, decreasing -3.41% in market capitalization over the past day.
XEC’s intraday trading volume has dropped by 56.75% due to the decreasing buying pressure.
XEC coin’s Rising Uptrend With ascending trendline
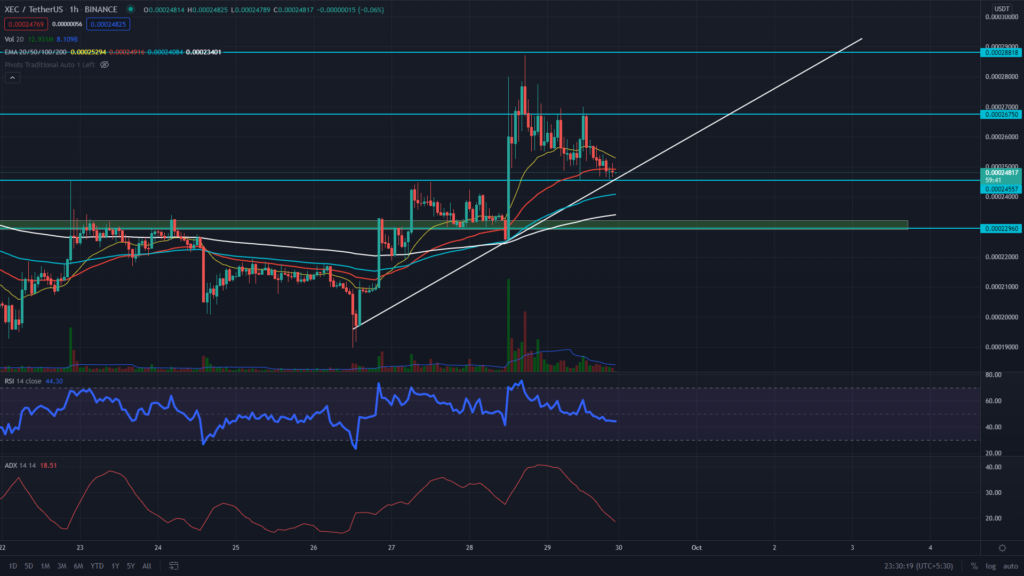
XEC coin price grows in a solid bullish uptrend as the price breaks show clear higher highs and higher lows. Moreover, the crypto investors may find this dip in price action to the support trendline as a lucrative entry spot with minimum risk.
As per price action, the demand levels for the coin are present at $0.000245 and $0.00023 marks. If the bullish trend continues from either support level, bulls may find resistance at $0.000267 or $0.000288.
The EMAs in the hourly technical chart soar more potent with a solid bullish alignment of these EMA’s, holding the prices in a bullish attack.
Conclusion – The XEC coin price rises higher with the assistance of the bullish exponential moving averages. Investors may confront entry points near the drops on the 20-period EMA. The coin price may shortly outreach the $0.000288 mark if the $0.00067 mark breaks.
Support – $0.000245 and $0.00023
Resistance – $0.000267 or $0.000288


