

- ZIL Token price action projects a bearish uptrend as it falls towards a crucial support zone.
- The 100-period EMA supports the falling prices in the weekly chart.
- The pair ZIL/BTC is trading at 0.000001966 BTC with an intraday gain of +2.02%.
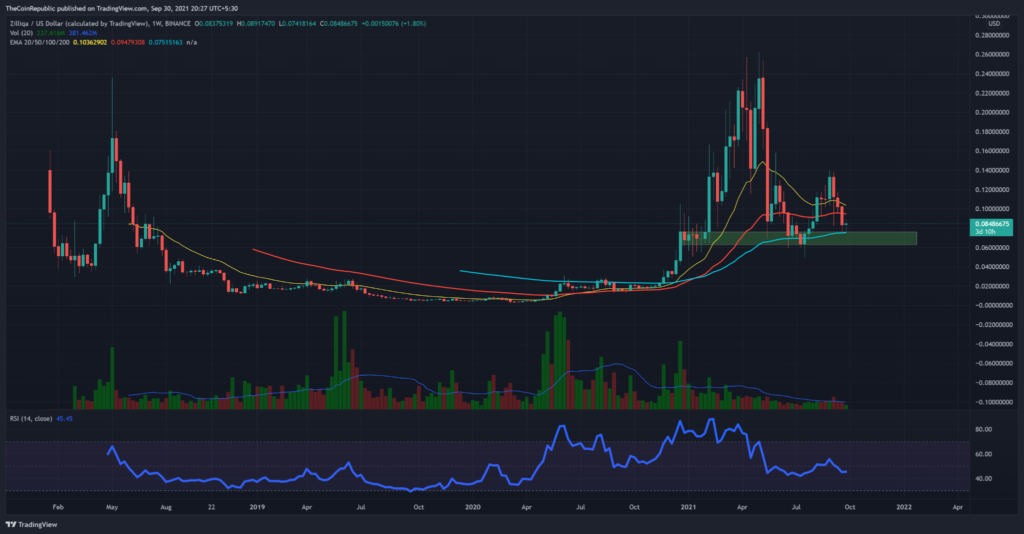
ZIL token price action shows a bearish engulfing candlestick in the weekly technical charts, which indicates increased selling pressure. In addition, the price is now closer to the $0.070 support zone, indicating that there has been an increase in selling pressure.
The intraday volume has risen above the 20-days volume MA, indicating that there is more selling pressure. In addition, the bearish alignment of the daily EMAs means that they rise higher, indicating a bearish attack.


ZIL Token trades at $0.084, an increase of +2.12% market capitalization over one day. This suggests that the price is on a bull reversal.
However, ZIL’s intraday trading volume has increased by around 78%.
ZIL Token’s Trends Lower In A Falling Channel
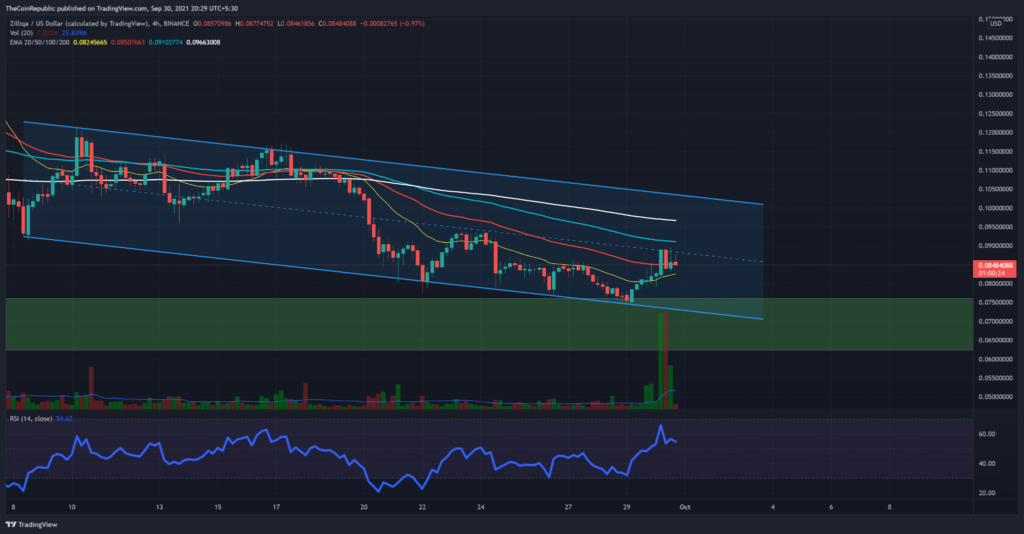
ZIL token prices fall in a descending parallel channel in the 4-hour chart. The token price is close to the channel’s central line indicating a downfall shortly. Investors may see the dip in price action at the support trendline.
According to price action, demand levels for the token are at the $0.090 and $0.10 mark. As a result, bulls could encounter resistance at $0.080 and $0.070 if the bullish trend persists from either support level.
The EMAs on the technical chart for the weekly chart are more powerful, with a solid bullish alignment because of the rise with a positive slope. Furthermore, the 100-period EMA keeps the price stable during the bullish attack.
The RSI indicator does not indicate a rise in underlying bullish inclinations. Furthermore, the RSI slope falls in the weekly chart.
The ADX indicator indicates a rise in trend momentum.
Conclusion: The ZIL token’s price has fallen for the past few sessions in the daily chart. However, the recent bullish reversal approaches the channel’s central line in the 4-hour chart. It can shortly result in a downfall. However, the breakout of this channel can result in a bull run.
Support – $0.080 and $0.070
Resistance – $0.090 and $0.10


