
- The RSI shows a steady decline in its concerning the LUNA coin price
- The LUNA/BTC pair trading at 0.0008152BTC, with a loss of 0.89%,
- The 24 hr volume of LUNA coins are $1.35 Billion
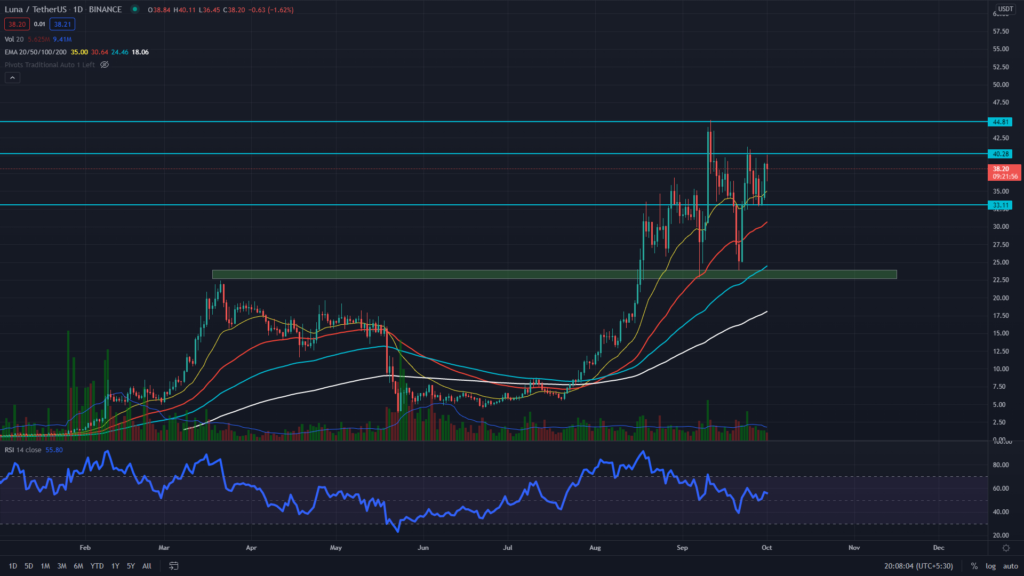
On September 22nd, the LUNA coin indicated the end of its moderate retracement phase when the price bounced from the $24 mark with a morning star candle pattern. Soon the coin price was also able to give a breakout from the nearest resistance zone around $35. Now, this level is acting as a good support level for the LUNA coin.
Concerning the EMAs, the LUNA price has a solid bullish trend, with the price trading higher than all the crucial EMA’s (20, 50, 100, and 200).


The RSI value (BULLISH) is at 56, indicating a bullish sentiment within the LUNA coin. However, the RSI shows a steady fall in its value, projecting the increasing strength of the market sellers.
The LUNA Coin Chart Displays A Double Bottom Pattern
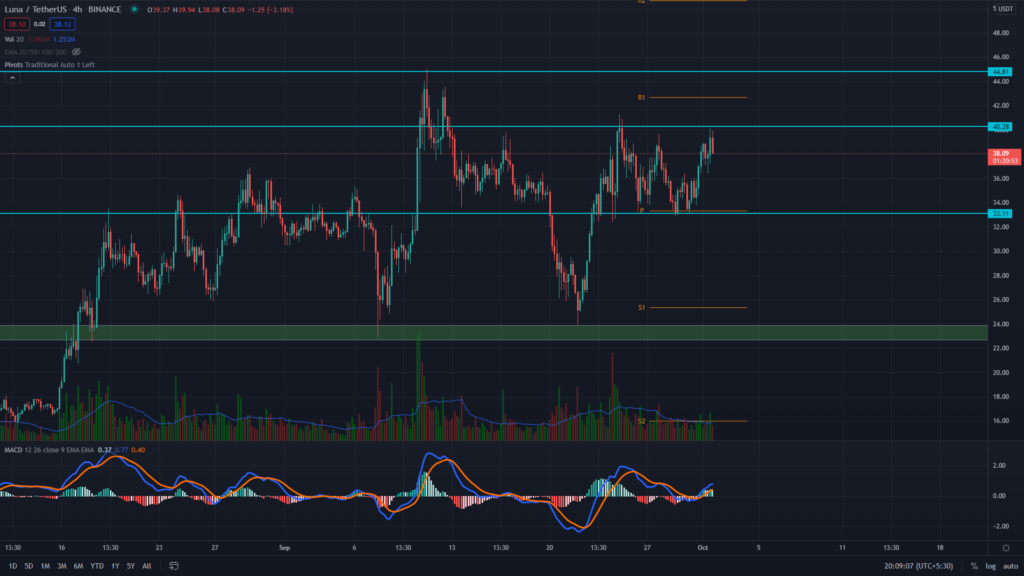
The LUNA coin shows the formation of a double bottom pattern in the 4hr time frame chart. The neckline for this pattern is at the $40 mark, holding a great long opportunity for Crypto traders once the coin price provides a strong breakout from this level and a good retest to validate the breakout. The current price for the LUNA coin at 38.31 is with an intraday loss of 1.37%.
The moving average convergence/divergence(MACD) indicator shows the MACD and signal lines have just moved above the neutral zone (0.00), indicating the bullish sentiment in the coin.
Conclusion: The LUNA coin indicates a strong bullish outlook concerning the price action and indicator. As mentioned, the technical chart shows the price continues with its uptrend after bouncing from the $24 support. Moreover, the double bottom pattern in this coin can provide a quick long trade for crypto traders, with the first target to the $45 mark.
Support: $33
Resistance $40


