
- ALGO Token price action indicates a bullish breakout of a long-coming resistance trendline in the daily chart.
- The 24-hour trading volume of the coin is $1,266,556,694.
- The pair ALGO/BTC is trading at 0.00004036 BTC with an intraday gain of +0.61%.
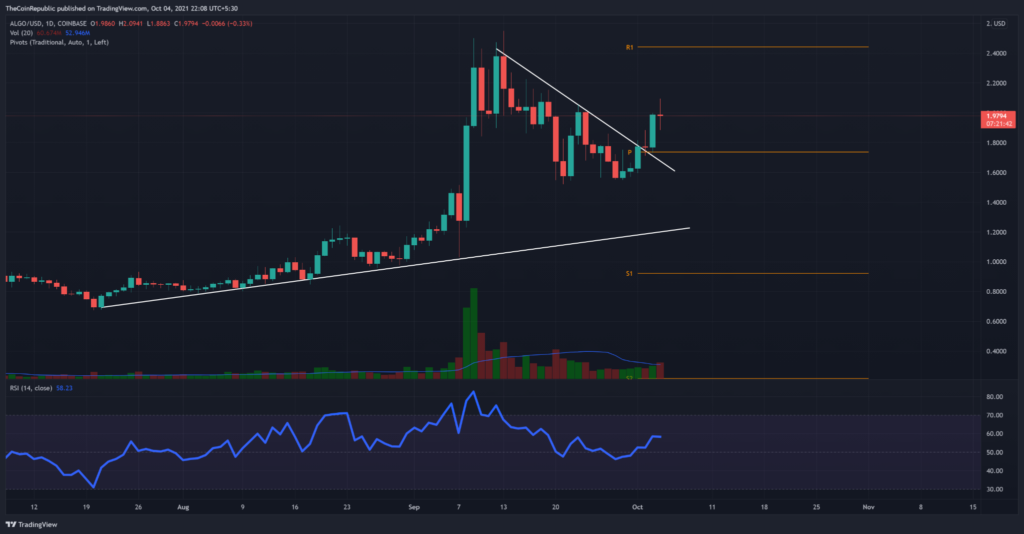
ALGO Token price action creates a bullish-engulfing candlestick on the daily Technical Chart. This indicates that bullish sentiments have been rising, and the breakout has occurred above the resistance trendline.
Intraday volume growth exceeding the 20-day volume MA is a sign of rising buying pressure. The bullish alignment of daily EMAs has risen higher, which indicates a bull run.


ALGO Token prices trade at $1.96. This is a +2.21% rise in 24 hours. It suggests that the price is on a bull run. The coin’s intraday trading volume grew by +74%
ALGO Token’s Price In 4-Hour Chart
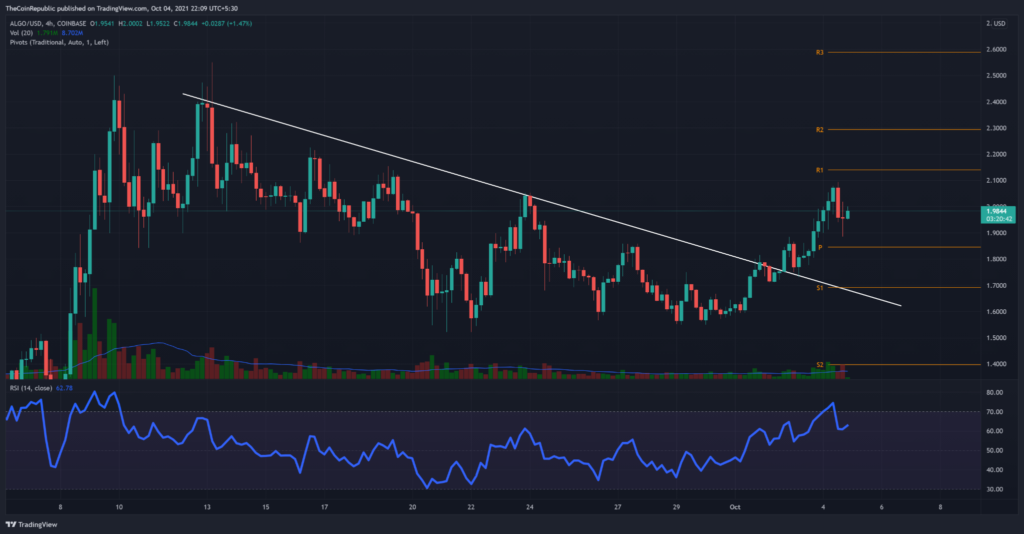
ALGO token prices rise in a bullish manner as the price retraces following a 4-hour increase. Thus, investors may see the price-action regression as a chance to make a bullish entry with minimal risk.
The demand levels for bulls are $1.8 and $1.5, according to pivot levels. If bulls maintain the bullish trend at any support level, they may face resistance between $2.1 and $2.3.
Due to the positive slope and more remarkable power of the 4-hour technical charts, the EMAs have a stronger position and are more bullish. This can keep prices stable during bullish movements. The chart also shows a bullish trend due to the inclined volume.
The ADX Indicator projects increased trend momentum.
Parabolic SARS indicate that bulls have taken over trend control.
The RSI indicator indicates a significant rise in bullish inclination
Conclusion: ALGO token prices are in demand after each retracement on the 4-hour chart. If it holds above $2, the token price could soon climb higher and reach the $2.5 mark.
Support – $1.8 and $1.5
Resistance – $2 and $2.3


