

- The RSi line shows a bearish divergence concerning the ONE token’s price
- The ONE/BTC pair was trading at 0.000004126 BTC with a gain of 9.21%
- The 24 hr trading volume in ONE is $383.8 Million
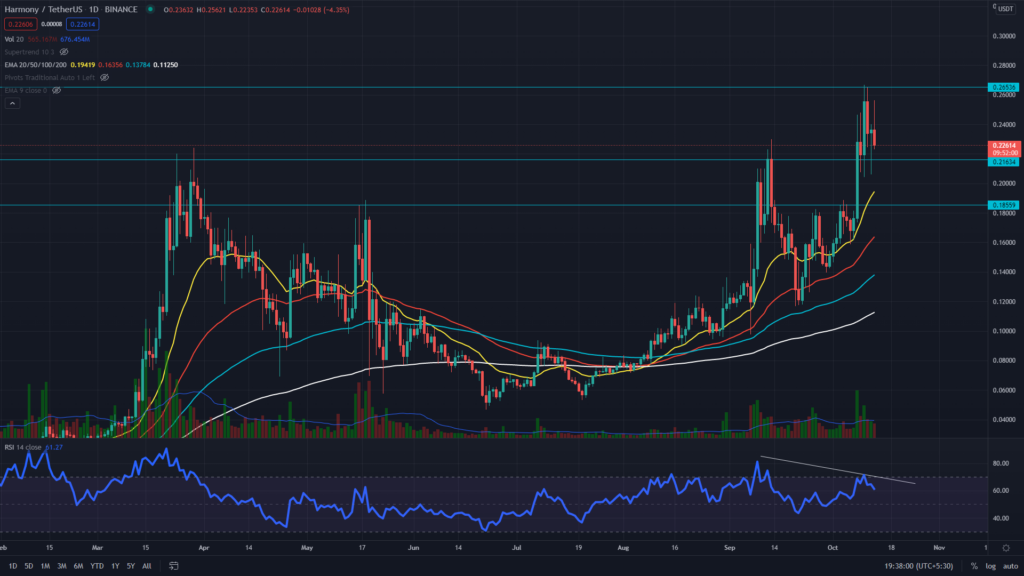
On October 8, the ONE token offered an excellent opportunity for crypto investors when the prince gave a strong breakout from the $0.216 neckline of a Cup and Handle pattern. After placing the mark of a new ATH at $0.266, the price returned to the broken resistance, looking for good support from here.
The crucial EMA’s shows that the ONE token’s price is trading higher than the EMAs 20, 50, 100, and 200, indicating a bullish trend.


The RSI value(BULLISH) stands at 60, indicating a bullish sentiment for the token. However, the Crypto Investors may notice a bearish divergence in the RSI chart, suggesting weakness in the bullish rally.
ONE Token Forming A Head And Shoulder Pattern
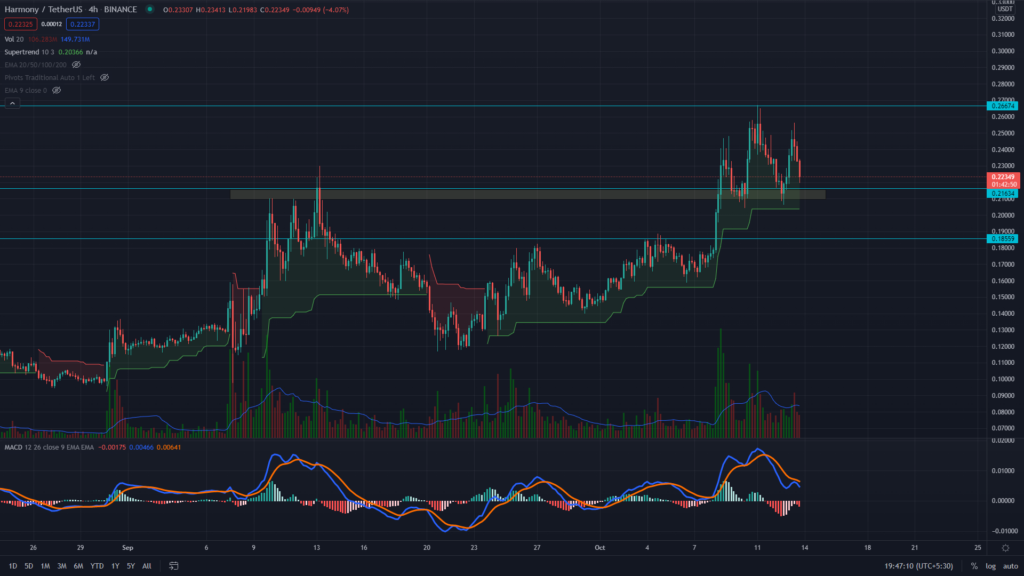
The ONE coin displayed a head and shoulder pattern in the 4hr time frame chart. The neckline for this pattern is at the $0.21 mark, and the price is currently approaching it. Though a bearish pattern for a retest for a longer time frame’s bullish pattern is not ideal, a bearish sentiment can only be considered if the price breakdown from the H&S pattern neckline.
The supper trend indicates the token is still in a bullish trend.
The MACD indicator (BULLISH) shows both the MACD line and signal lines moving higher above the neutral zone (0.00), indicating bullish momentum. However, these are steadily dropping towards the neutral line.
Conclusion: From the technical perspective, the overall trend for the ONE token is strongly bullish. However, the bearish divergence in RSI and a lower time frame bearish pattern create some doubt about the bull rally. Still, as mentioned above, only after a proper breakdown from $0.21 should trigger some conformation to these concerns.
Support– $0.216
Resistance– $0.266


