

- TEL token shows a bullish crossover of the 20 and 200 EMA in the daily time frame chart
- The TEL/BTC pair was trading at 0.0000004059 BTC with a gain of 20.09%
- The 24 hr trading volume in TEL is $62.8 Million, indicating a 321% gain,
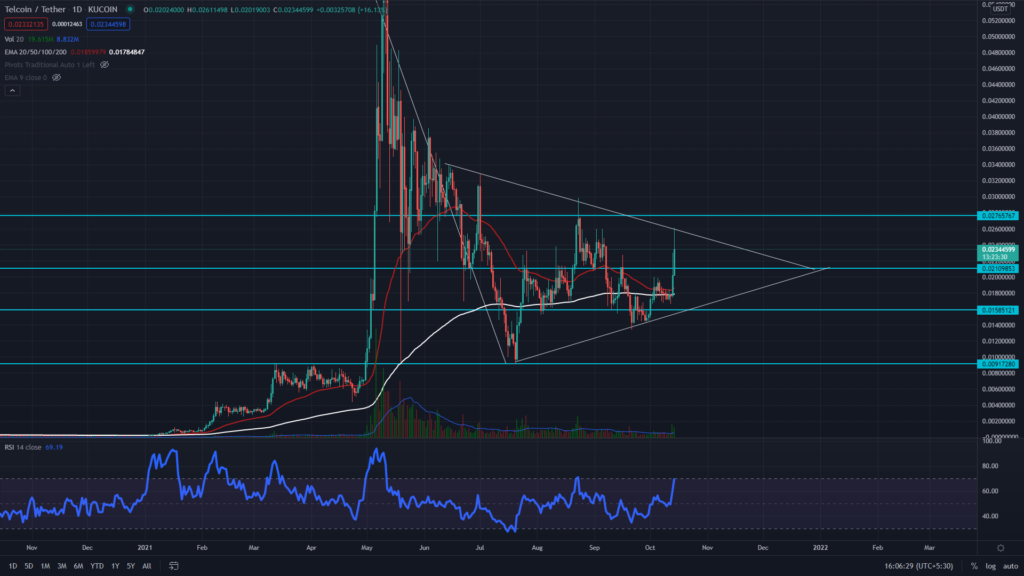
The TEL Token shows the formation of a bearish pennant pattern in the daily time frame. This pattern usually indicates a downside breakout providing an excellent opportunity for short traders. However, as the triangle part of the pattern is actually a consolidation phase, a proper breakout from its trendline decides the final decision. The current price of the TEL token is $0.0234, with an intraday gain of $15.91.
Regarding the EMAs, the TEL token’s price is trading high above the EMAs 20, 50, 100, and 200, indicating a strong bullish trend. The chart also shows a bullish crossover of the 20 and 200 EMA.


The RSI value (BULLISH) stands at 69, indicating a bullish sentiment for this token. Moreover, the RSI has shown an impressive recovery concerning the token’s price action.
TEL Token Chart In The 4hr Time Frame
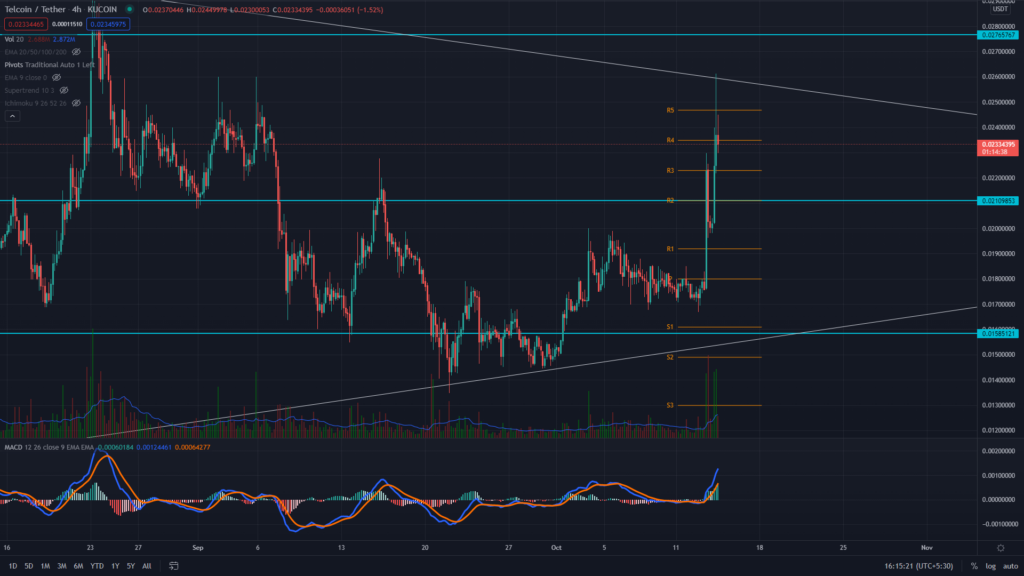
The TEL token price has shown an impressive rally in the last seven days, with a gain of around 50%. However, now the price has reached the overhead resistance trendline, it’s facing good selling pressure here, which is displayed by a long higher price rejection candle. With respect to the pennant pattern, the price could plunge back to the support trendline.
The moving average convergence/divergence indicator (BULLISH) shows both the MACD line and signal lines moving higher above the neutral zone (0.00), indicating bullish momentum. The histogram also displays long green bars in its chart.
Conclusion: From the technical perspective, The TEL token price is resonating in a symmetrical triangle-type pattern. The crypto traders interested in this token should add it to their watchlist and wait for the price to break out from either of the trendlines.
Support– $0.0258
Resistance– $0.0211


