

- NEXO token shows the 50-and-200-day EMAs are on the verge of giving a golden crossover
- The NEXO/BTC pair was trading at 0.0003689 BTC with a gain of 11.35%
- The 24-hr trading volume in NEXO is $23.78 Million, indicating an 8.09% loss
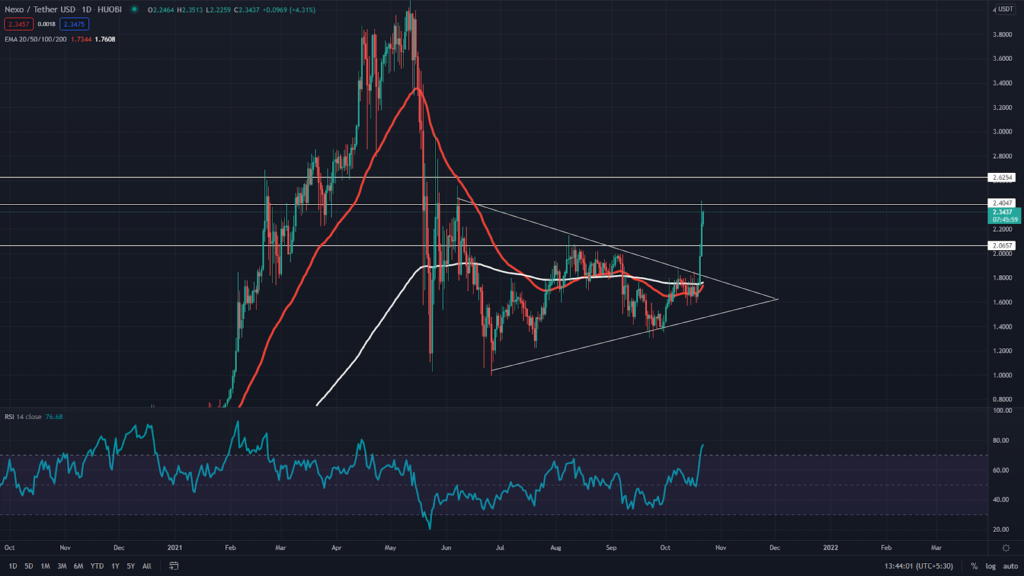
As mentioned in my previous article on NEXO, this token’s technical chart displayed the formation of a pennant pattern in the daily timeframe. The price provided a decisive breakout from the overhead resistance trendline on October 20th, providing an excellent long opportunity for crypto traders. The token price has reached the expected target and now facing a crucial resistance of $2.4
The NEXO token’s price is trading high above the EMAs 20, 50, 100, and 200, indicating a bullish trend in its chart. Moreover, it seems the 50 and 200 EMA can soon give a golden crossover, attracting even more buyers to the token.


The RSI value (BULLISH) is 76, indicating a bullish sentiment about this token. Moreover, the RSI has shown impressive growth, supporting the ongoing rally.
NEXO Token Chart In The 4hr Time Frame
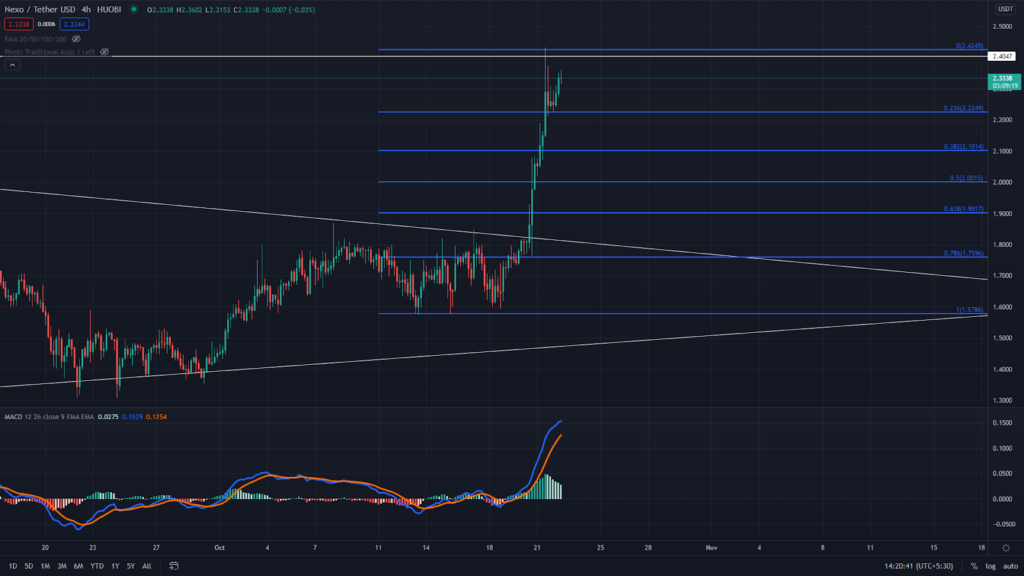
The NEXO token experienced a decent selling pressure above the $2.4 resistance level, displayed by some long wick candles in its chart. However, today the price is again ready to retest this level and see if it can provide proper resistance or not. The NEXO token’s current price is $2.3, with an intraday gain of 4.2%.
Respecting the current price action, the MACD indicator shows both the MACD line and signal lines are moving high above the neutral zone (0.00), confirming a strong bullish momentum in this token.
Conclusion: From a technical perspective, the overall trend for the NEXO token is bullish. However, as mentioned above, the token price is in front of strong resistance, and the crypto trade should wait for a proper signal for a reversal or breakout before entering with a new position.
Support – $2.2
Resistance – $2.4


