

- The Quant token price sustains above the EMA-55 during intraday.
- The 24-hour trading volume is at $47 million.
- QNT/BTC pair is trading positive by 3.1% at 0.00484160 BTC.
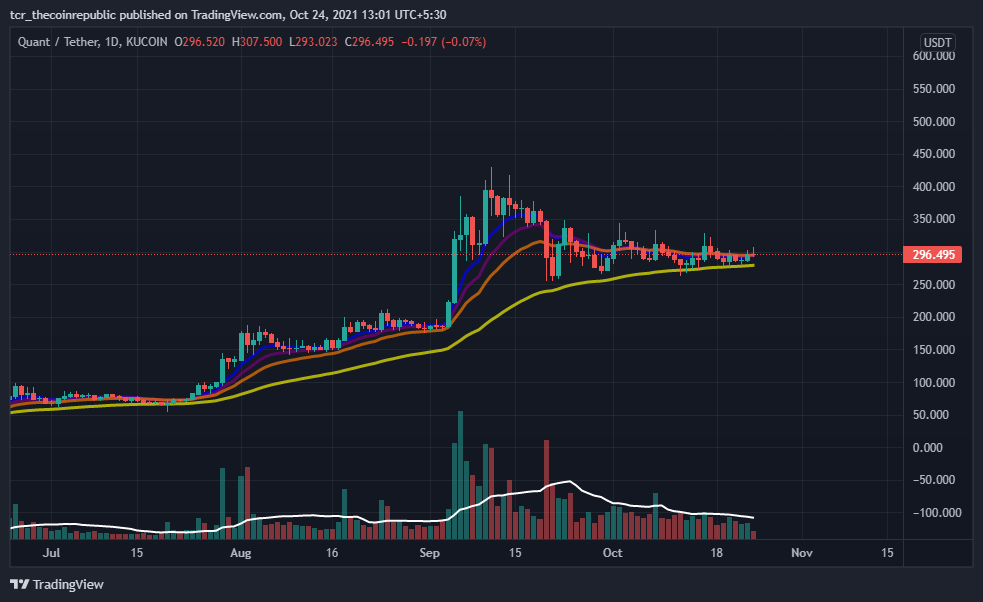
On the daily price chart of Quant token, Moving Average Exponential (EMA), consisting of 8,13,21,55-EMA, Acts as reliable support in the coin price movement. Investors may observe the price sustains above the yellow line, so until the price resides above all the EMA’s, it will assure an uptrend in QNT.
Trading volume (2.013 M) is beneath the 20-day moving average (6.179 M). The volume is less, so the cost is in a range. Investors may also find that the volume is decreasing. This indicates that unusual fluctuations are common on subsequent trading days.


Quant Token Price Action Struggles Around The Support Zones
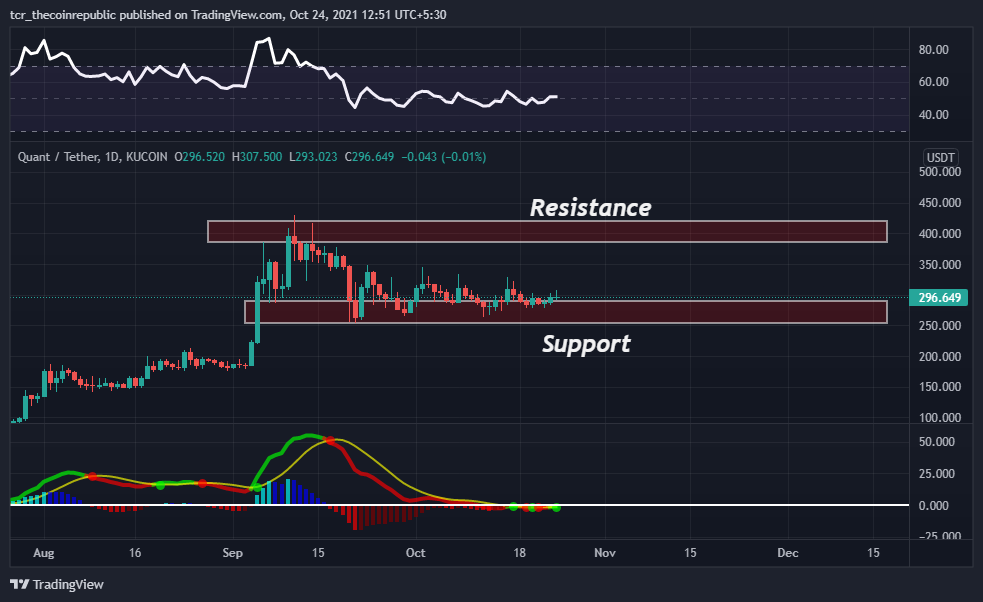
Quant token daily price charts show a sideways trend. Based on the price action, the resistance zone is located at 380- 420 USDT. On the other hand, the support zone to look for is 250- 300 USDT. Therefore, the chart shows an inverted hammer candlestick pattern during the day.
The RSI gave a signal of 52 which is (neutral), projecting a flat trend in the currency for the short-term. Investors can observe an RSI line is stuck at a range of 50 on the index. It can surge in future trading sessions.
The MACD indicator gives (bullish) cross over the signal line on October 24, demonstrating a buy signal in the coin. Additionally, Investors can see emerging tiny green bars on the Histogram index.
Conclusion
Today’s Quant price is $294.47 with a 24-hour trading volume of $47966137. QNT prices have increased 2.3% in the past 24 hours. There are 13 million QNT coins in circulation and a total of 14.6 million coins.
The RSI shows a neutral sign, and MACD points to a buy signal. The traders have prompted low volume. In fact, the cost is stuck in a range around support levels. A market overview also shows that this pattern will continue to rise in the coming trading days.
Resistance Level: $380- $420
Support Level: $250 – $300


