

- The CELO crypto above all the multiple EMA’s during intraday.
- The 24-hour trading volume is at $87 million.
- CELO/BTC pair is trading positive by 4.0% at 0.00011102 BTC.
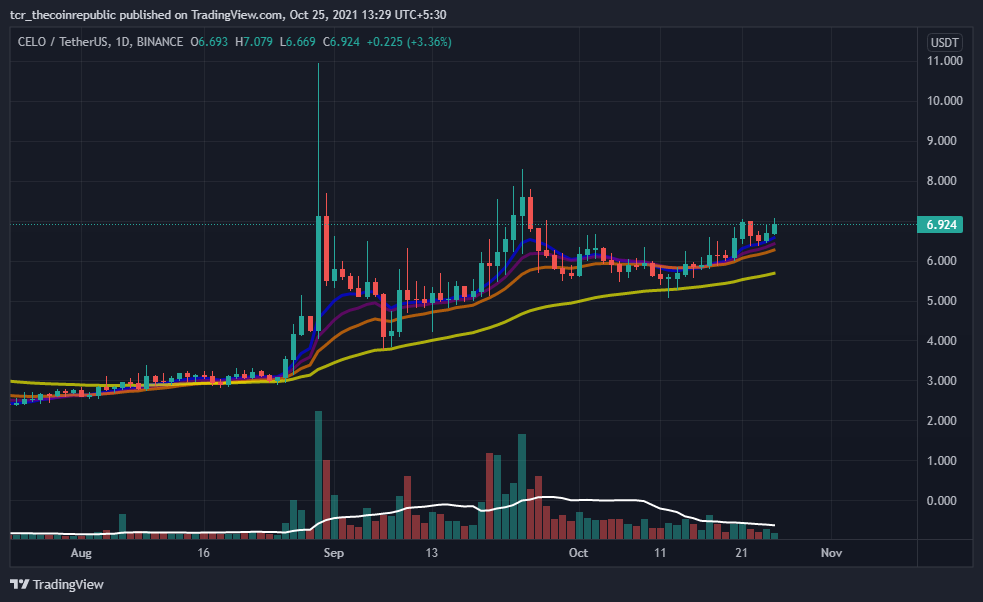
On the daily price chart of Celo crypto, The Moving Average (EMA), which includes the 8,13,21,55 EMA, acts as reliable support for currency price movements. Investors may notice a price break above the yellow line, ensuring a CELO uptrend until the price resides above all the EMA’s.
Trading volume (2.178 M) is beneath the 20-day moving average (5.293 M). The volume is moderate, so the cost is moving upside. Investors may also find that the volume is decreasing. This indicates that unusual fluctuations are common on subsequent trading days.


CELO Crypto Gradually Moving Towards The $8.0 Resistance
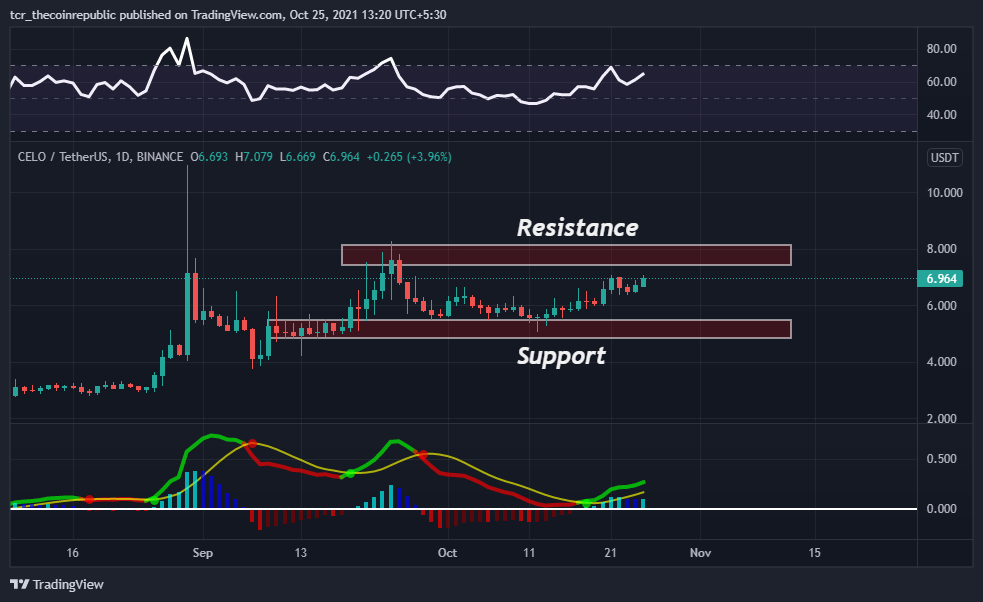
CELO crypto daily price charts show an uptrend. Based on the price action, the support zone is located at 4.80- 5.50 USDT. On the other hand, the resistance zone to look for is 7.50- 8.0 USDT. Therefore, the chart shows a bullish harami candlestick pattern during the day.
The RSI showed a 64 (bullish) signal, projecting a buying in the currency for the short-term. Investors can observe an RSI line forming an inclined slope on the index. It can surge in future trading sessions.
The MACD indicator gives (bullish) cross over the signal line on October 18, demonstrating a buy signal in the coin. Additionally, Investors can see green bars on the Histogram index.
Conclusion
Today’s price is $6.98, with a 24-hour trading volume of $87,888,086. The CELO prices have increased by 6.9 percent in the last 24 hours. 330 million CELO coins are in circulation, and there are a total of 1 billion coins.
The RSI shows a buy sign, and MACD points to a buy signal. The traders have prompted high volume. In fact, the cost is framing new higher highs. A market overview also shows that this pattern will continue to rise in the coming trading days.
Resistance Level: $7.50 – $8.0
Support Level: $4.80 – $5.50


