

- The ATOM coin price sustains above the 55-EMA during intraday
- The 24-hour trading volume is at $1.524 billion.
- ATOM/BTC pair is trading positive by 3.8 at 0.00066035 BTC.
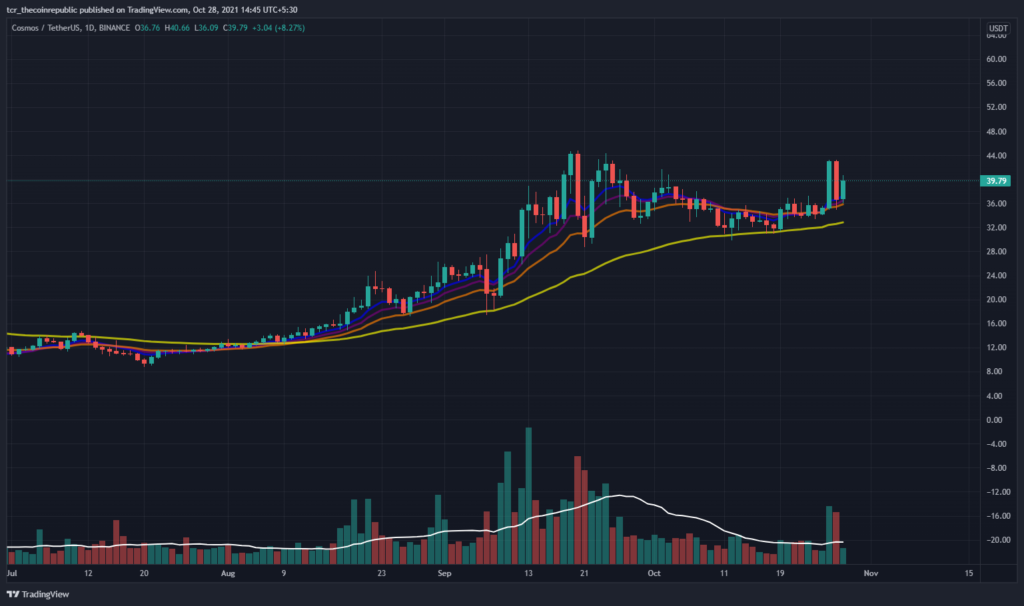
On the daily price chart of ATOM coin, The Moving Average (EMA), which includes the 8,13,21,55 EMA, acts as reliable support for currency price movements. Investors may notice price moves above the yellow line, ensuring an ATOM uptrend until the price resides above the EMA’s.
Trading volume (2.583 M) is close to the 20-day moving average (3.489 M). The volume is high and increasing, so the cost is moving upside. Investors may also notice a reduction in volume. This indicates that unusual fluctuations are common on the following trading days.


ATOM Coin Testing the Critical Resistance Zone For a Breakout
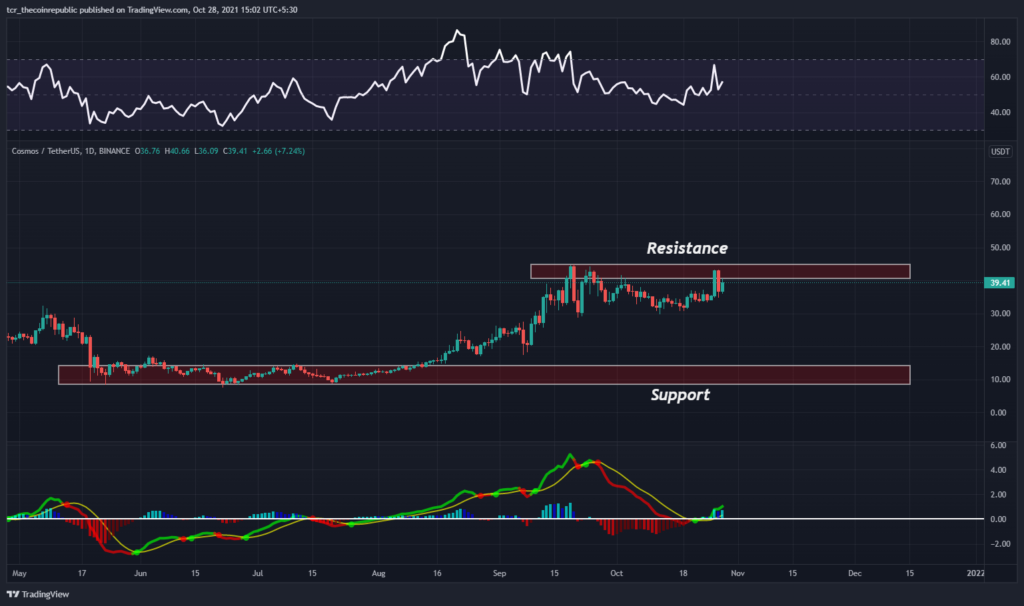
ATOM coin daily price charts show an uptrend. Based on the price action, the support range is $10 – $14. On the flip side, the resistance area that you should be looking for is between $40 and $44.Therefore, the chart shows a bullish harami candlestick pattern during the day.
The RSI showed a 56 (bullish) signal, Expecting to buy in the short term. Investors may find that the RSI line is sloping up on the indicator. It may rise in the coming trading days.
The MACD shows a (bullish) cross above the signal line on October 14th, indicating a buy signal for the currency. In addition, investors can see green bars in the histogram indicator.
Conclusion
Cosmos is currently trading at $40.21 on a 24-hour trading volume of $1,524,731,503. ATOM prices have increased 7.0% in the past 24 hours. 280 million ATOM coins are in circulation and there is a total of unlimited.
RSI shows and MACD indicates a buy signal. Traders have directed high volume. In fact, the cost is testing the resistance zone. A market overview also shows that this pattern will continue to surge in the coming trading days.
Resistance Level: $40 – $44
Support Level: $10 – $14


