

- The QTUM coin is currently trading at the $17.02 mark, with an intraday gain of 7.38
- The QTUM/BTC pair trades at 0.000276 BTC, with a gain of 19.82%
- The 24-hour trading volume in The QTUM coin is $2.45 Billion
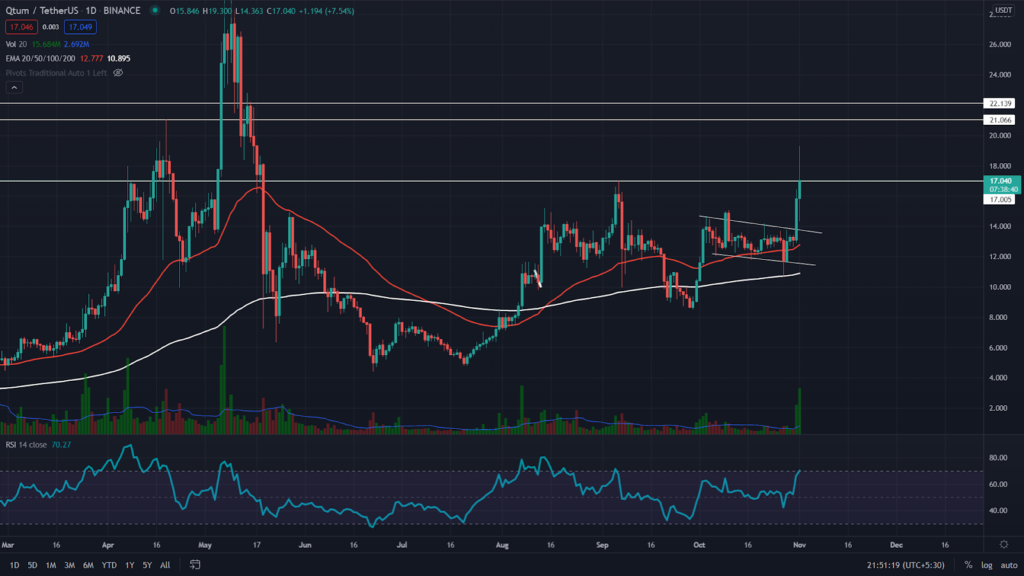
The QTUM coin initiated a significant up movement when the price broke out from the resistance trendline of the parallel channel pattern. This rally is currently trying to breach the previous swing high of the $17 mark and receive strong support from the crypto trade, indicating a 194.5% hike in the intraday volume activity.
The EMA’s indicate that the QTUM coin is bullish, as the price is trading high above the crucial EMA of 20, 50, 100, and 200.


The RSI value is 77, indicating a bullish sentiment within the QTUM coin. Moreover, the RSI chart shows an impressive growth similar to the coin’s price
The QTUM Coin Crypto Chart in the 4-hour Time Frame
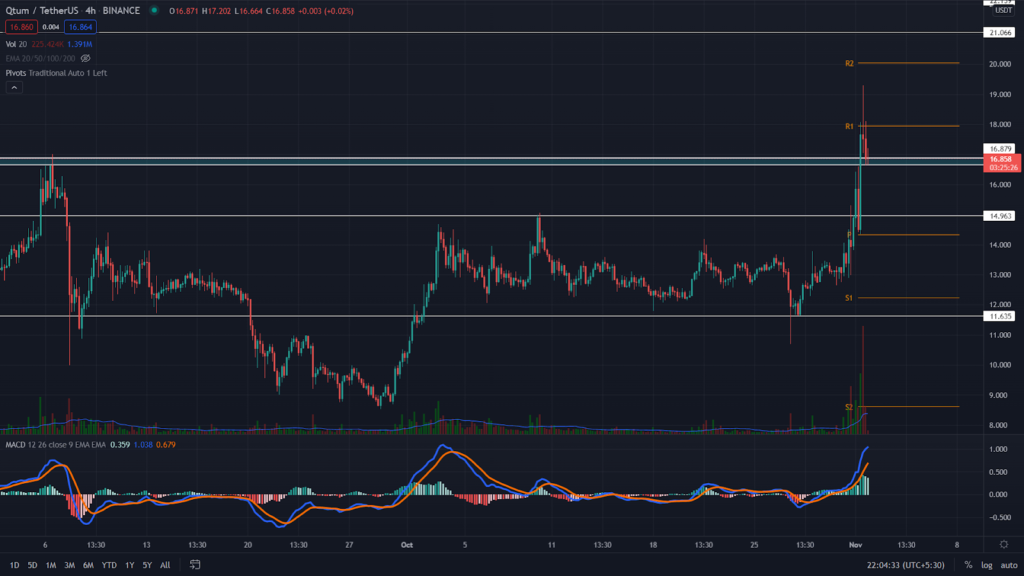
The QTUM coin shows a minor pullback in its chart, as the price has to retest the $17 mark to validate if the breakout was genuine or not. If the chart shows enough demand pressure at this level, the crypto traders can consider taking a long opportunity in this coin.
As per the traditional pivot levels, the nearest resistance level for QTUM price is at $18, followed by the $20 mark. In case the retest of the $17 support fails, the next support for the coin will be at $14.5
The moving average convergence/divergence(MACD) indicator shows both the MACD line and signal are moving above the neutral zone(0.00), indicating a strong bullish momentum in the coin.
Conclusion: From a technical perspective, the QTUM coin indicates an overall uptrend in its chart. Moreover, the chart suggests that the coin could continue its rally as the price has breached the previous swing high of $17 and is currently going through a retest phase. Thus, if the price manages to sustain above the $17 level, the coin traders can consider positioning their funds in this QTUM coin.
Support: $17, $15
Resistance: $18, $20


