

- The trading volume of the AAVE token in the last 24-hours at the time of writing this article is +6%
- The price of AAVE/BTC and AAVE/ETH at the time of writing this article is 0.005194 BTC and 0.07349 ETH, respectively
- 20MA and 50MA are below the 100MA
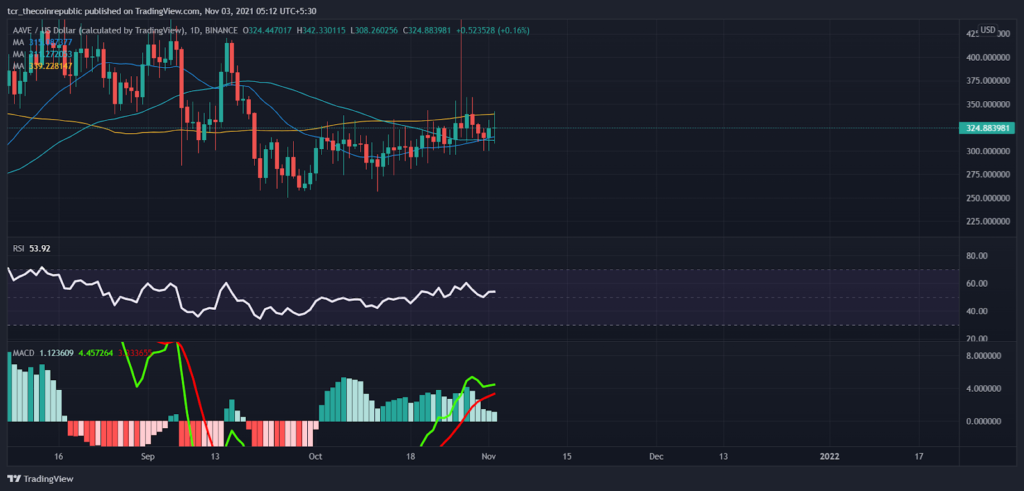
Long term view:-
In the daily chart time interval, we can see the price is near the resistance. The bulls are trying their best to push the price up, but the bears are winning by pushing the price down. Let’s look at the technical indicator to see if the price will break the resistance or not?. Firstly, we can see the MACD, which is showing green histograms as the MACD line is above the signal line, but the MACD line may cross the signal line because the MACD line is very close to each other. In addition to that, the RSI is in the Neutral zone near 52.95, and the RSI line is pointing towards the oversold zone of 30, which means the bears are winning the fight against the bulls. Lastly, we can see the Moving average as the 20MA is above the 50MA, but both the 20MA and 50MA are below the 100MA, which is a bearish sign.
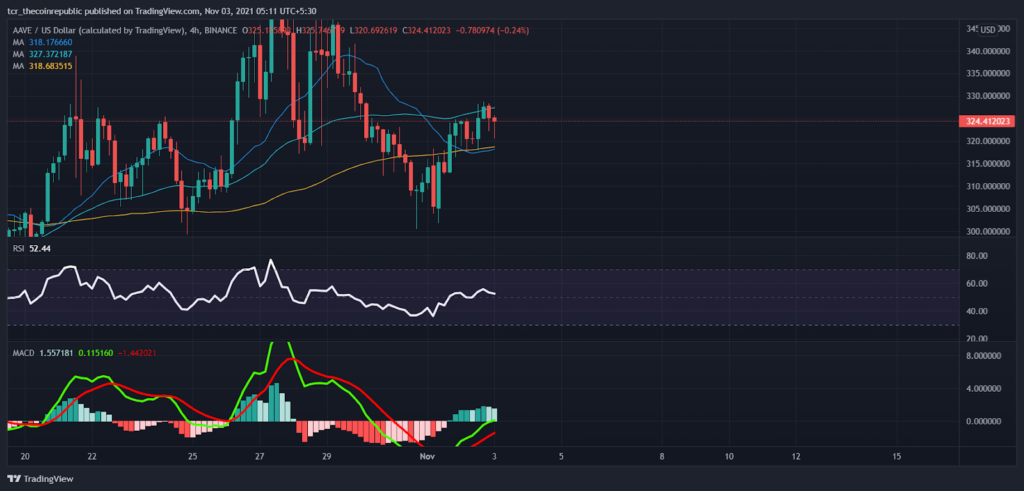
Short term view:-
In the 4-hour time interval, we can see the price is heading towards the support. The MACD is showing green histograms as the MACD line is above the signal line, and there is no sign that the lines will change their direction. In addition to that, the RSI is in the neutral zone near 50, and the RSI line is pointing towards the oversold zone of 30, which means the bears are winning the fight against the bulls. Lastly, we can see the Moving average as the 20MA is below the 100MA, which is a bearish sign. Also, the 50MA is above the 100MA and 20MA.


Conclusion:-
Looking at both the long term and short term, we can see the price may not break the resistance in the daily chart and may head towards the support from there. The bulls can push the price back up. In the 4-hour time interval, we can see the RSI heading towards the oversold zone, which means bears control the price.
RESISTANCE:-$340,$360
SUPPORT:- $309,$295


