
- The INJ token price flies above the 55-EMA during intraday
- The 24-hour trading volume is at $48 million.
- INJ/BTC pair is trading positive by 9.9% at 0.00020995 BTC.

Moving Average (EMA) In the INJ token daily price chart containing 8,13,21,55 EMA, it is reliable support for currency price movements. Investors can find that price moves around the yellow line and guarantee an uptrend for INJ as long as prices are above the moving average.
Trading volume (772.855 K) is above the 20-day moving average (623.844 K). The volume is high, so the cost increases. Investors may also notice an increase in volume. This indicates that unusual volatility is common on the following trading days.


INJ Token Price Action Shows no Signs of Turning Down
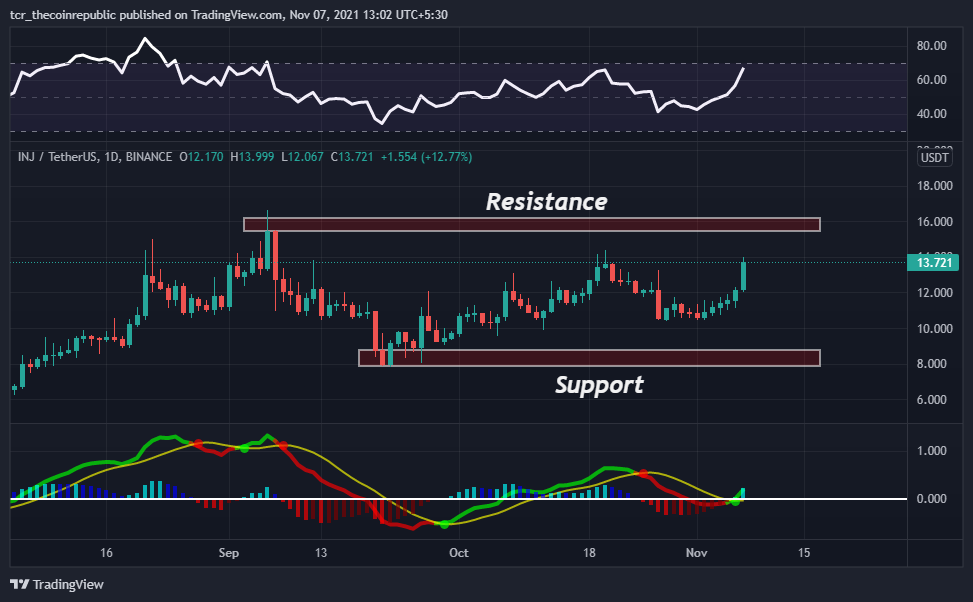
The daily price chart of INJ token is on the rise. Depending on the price movement, the support range is between $8.0 and $8.50. On the flip side, the resistance area you should be looking for is $15.50- $16.
The RSI showed a signal of 66 (bullish) with a short-term buy forecast. Investors may find that the indicator’s RSI line is sloping upside. A rise can happen on future trading days.
The MACD shows a (bullish) cross above the signal line on November 06, indicating a buy signal for the currency. In addition, investors can see green bars in the histogram indicator.
Conclusion
The price of the Injective Protocol is $13.04 today on a 24-hour trading volume of $48,071,509. INJ’s price has been up 11.4% in the past 24 hours. Its circulating supply is INJ 44 million for a total supply of 100 million.
RSI and MACD indicate a buy signal. Traders have directed high volume. In fact, the cost is moving towards the resistance zone. A market overview also shows that this pattern will continue to surge in the coming trading days.
Resistance Level: $15- $15.50
Support Level: $8- $8.50


