
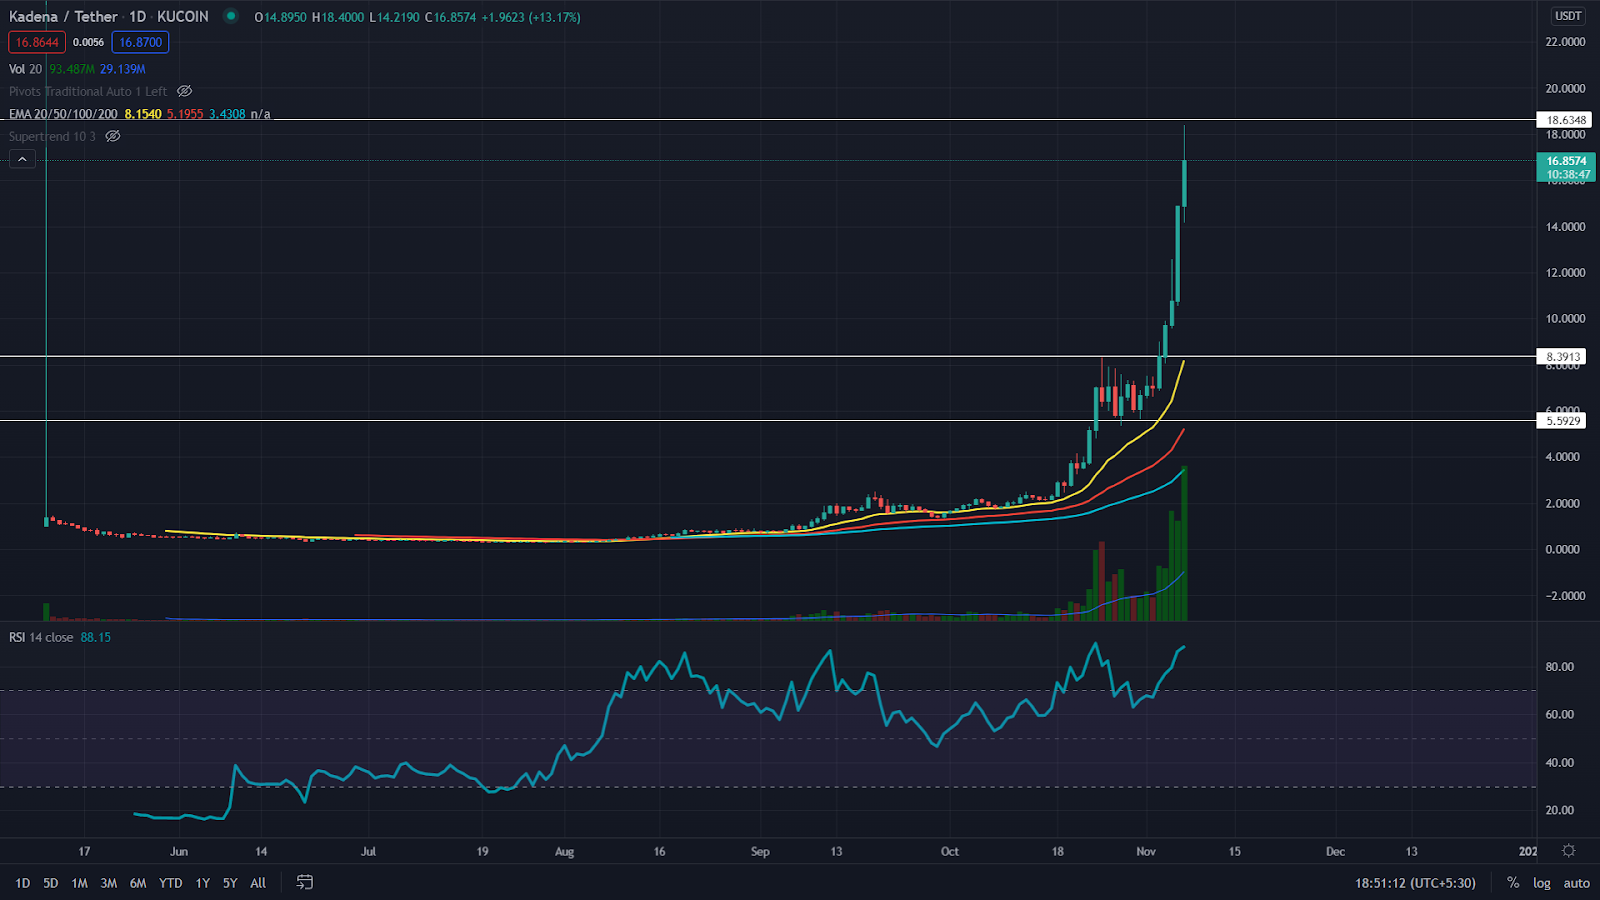
- The KDA coin’s daily RSI line has reached the overbought zone
- The KDA/BTC pair was trading at 0.0002739 BTC with a gain of 38.79%
- The 24hr trading volume for the KDA coin is $192.2 Million, indicating a 223.2% hike
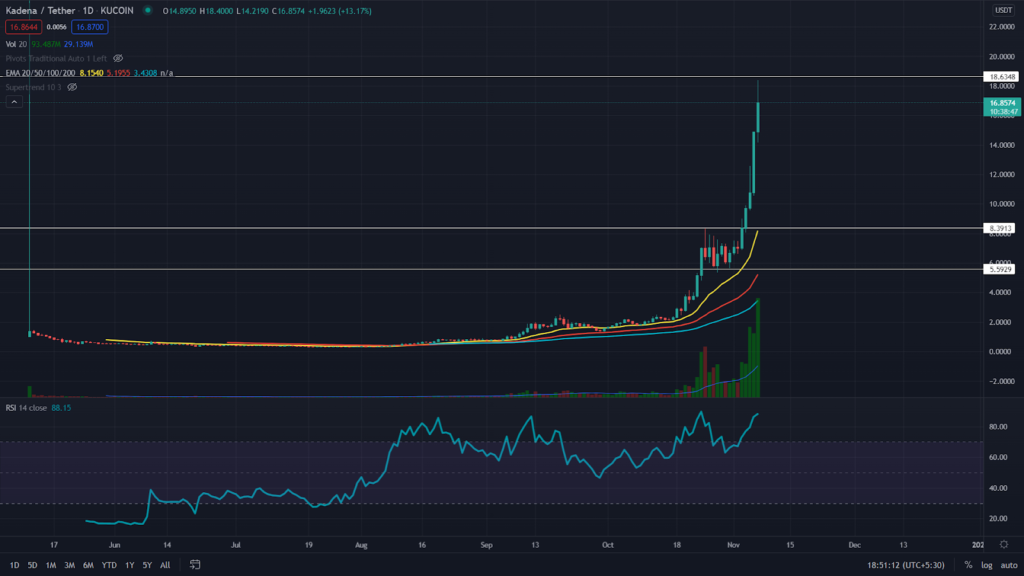
Source- KDA/USD on Tradingview
October has been one of the greatest times for all the KDA investors, where the coin initiated a remarkable rally in its price. Calculating from the 1st October, the coin has indicated an 1165% growth and has marked $18.38 level as the new All-TIme High for KDA coin


The EMA’s show that the KDA coin trades above all the important EMA’S 20, 50 100, 200, and 200, indicating a bullish trend alignment.
The RSI value (BULLISH) is 88, indicating a bullish sentiment about this coin as the RSI line has shown significant growth, supporting the ongoing rally. However, it also suggests the coin has reached an overbought level.
The 9 EMA Act As Dynamic Support For KDA In The 4hr Time Frame Chart
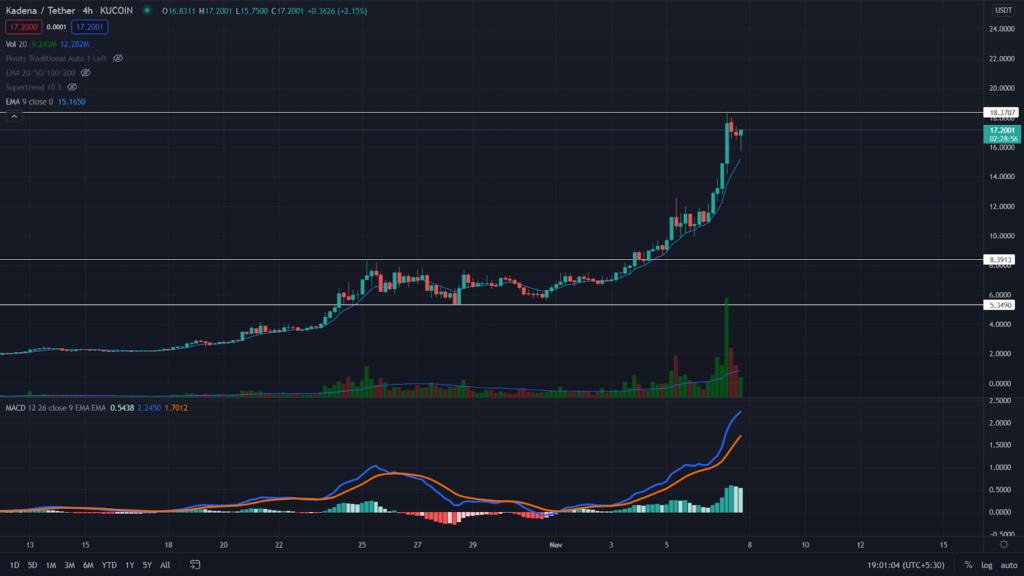
Source- KDA/USD on Tradingview
The KDA coin rally has currently stopped at the $18.38 level and indicates a minute pullback in its technical chart. Furthermore, it seems the 9 EMA is providing dynamic support to the KDA coin and can also offer an early signal if its price starts giving a bearish reversal.
As per the daily traditional pivot levels, the nearest resistance for the KDA price is $20, followed by $24. And for the opposite side, the nearest support the crypto traders can expect is $16.2, followed by $12.3.
The moving average convergence/divergence indicator (BULLISH) shows both the MACD signal line and signal line move higher than the neutral zone (0.00), indicating the bullish sentiment in the KDA coin.
Conclusion: From the technical perspective, the KDA coin shows a strong uptrend in the chart with no signs of proper reversal yet. Hence, the trend traders looking for long opportunities in the Cryptomarket can consider trading in KDA coins.
Support: $0.132
Resistance: $18.38


