

- The GRT token chart displays a golden crossover of the 50-and-200-day EMA
- The GRT/BTC pair traded at 0.0000179 BTC, with a gain of 9.25%
- The 24-hour trading volume in The GRT token is $458 Million, indicating a 7.46% loss
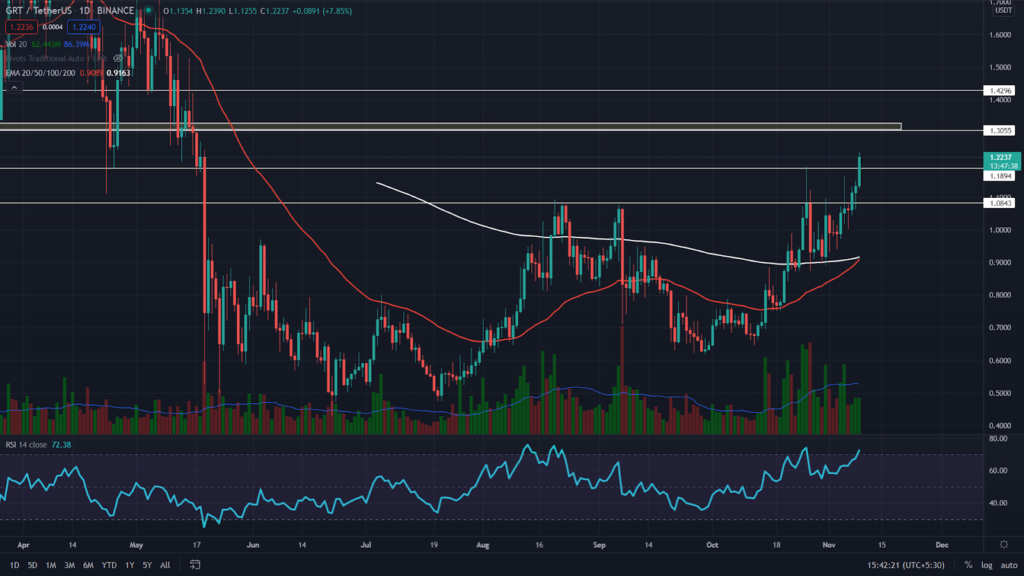
As mentioned in my previous article on Graph, the GRT token was experiencing intense selling pressure of the prior swing high of $1.085 resistance, resulting in a bearish reversal in its technical chart. However, on November 7th, the token price finally managed to break free from this crucial resistance, providing an excellent long opportunity for crypto traders.
Concerning the EMAs, the GRT token indicates a bullish trend, where its price is trading above the crucial EMAs of 20, 50, 100, and 200. Moreover, the chart also shows a golden crossover of the 50 and 200 EMA, encouraging more buyers in this token.


The RSI value is 72, indicating a bullish sentiment within the GRT token.
The GRT Token Displayed A CUP And Handle Pattern
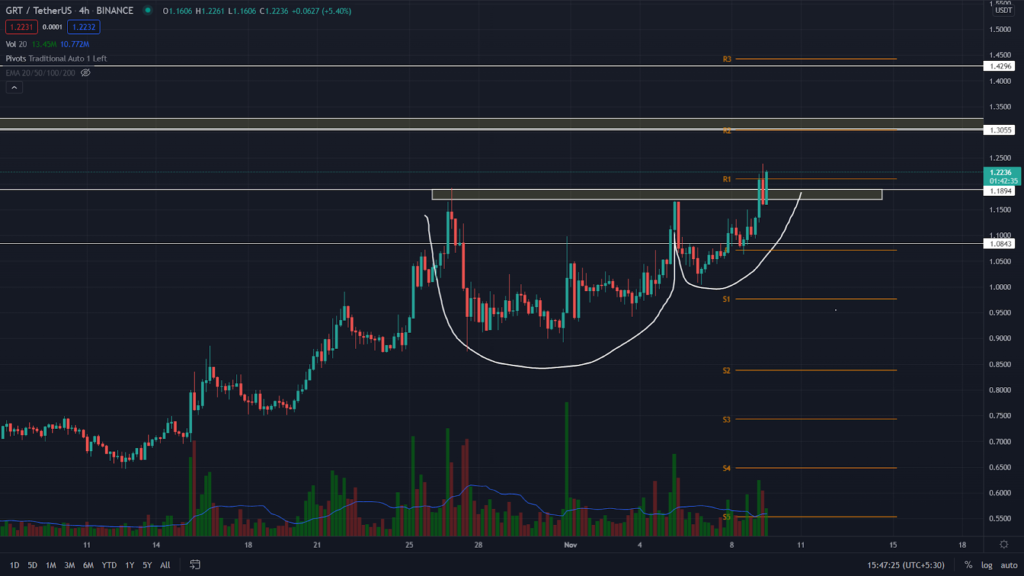
The GRT token showed the formation of a cup and handle pattern in the 4-hour time frame chart. This pattern has its crucial resistance (neckline) level at the $1.18 mark, and the price has already provided a breakout and retest to this broken resistance providing a long opportunity for crypto traders. The GRT coin’s price is trading at $1.22, with an intraday gain of 7.89%.
According to the traditional pivot levels, the nearest resistance level for GRT price is $1.3, followed by the $1.44 mark. If the GRT price drops below the $1.12 support, the next support for the token will be $1.075.
Conclusion: From a technical perspective, the GRT token has indicated a steady rally in the GRT/USD chart. As mentioned above, the coin price has also reclaimed the previous swing of the $1.08 mark, projecting more potential for this token.
Support: $1.12
Resistance: $1.3


