

- The ERG coin price spikes above the 55-EMA during intraday
- The 24-hour trading volume is at $97 million.
- ERG/BTC pair is trading positive by 6.8% at 0.00015835 BTC.
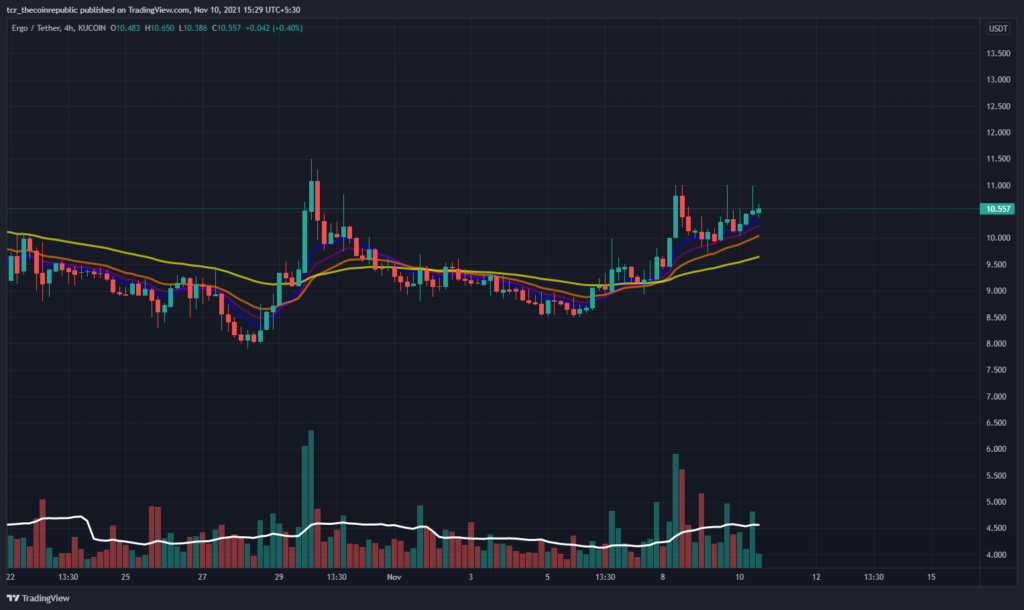
Moving Average (EMA) In the ERG coin daily price chart containing 8,13,21,55 EMA, it is reliable support for currency price movements. Investors can find that price moves above the yellow line and guarantee an uptrend for Ergo as long as prices are above the moving average.
The volume (120.677 K) is below the 20-day moving average (369.324 K). The volume is small, so the cost is struggling. Investors may also notice a reduction in volume. This indicates that unusual changes are normal on the following trading days.


ERG Coin Price Trend May Give Breakout if High Buying Volume Initiates
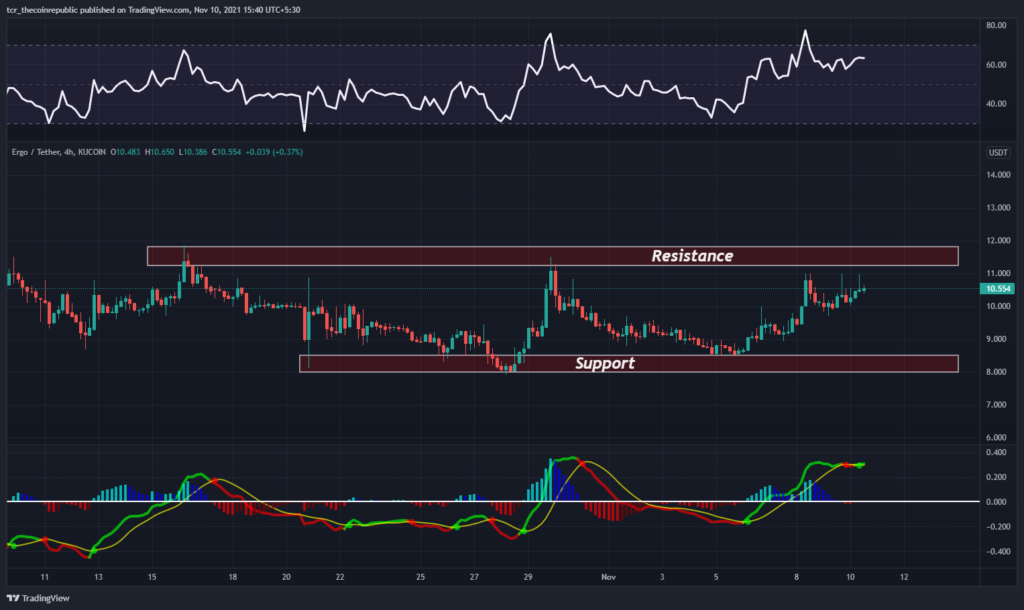
The daily price chart of ERG coin is on the rise. Depending on the price movement, the support range is between $8 – $8.50. On the flip side, the resistance area you should be looking for is $11.0 – $12.0.
The RSI showed a signal of 64 (bullish) with a short-term buy sign. Investors may find that the indicator’s RSI line is sloping upwards. A rise can happen on future trading days.
The MACD shows a (bullish) cross above the signal line on November 10, indicating a buy signal for the currency. In addition, investors can see emerging green bars in the histogram indicator.
Conclusion
Today’s price for Ergo is $10.58 with a 24-hour trading volume of $4,475,119. ERG prices have increased 4.8% in the past 24 hours. There are 46 million ERG coins in circulation, making a total of 97.7 million coins.
RSI and MACD indicate a buy signal. Traders have directed moderate volume. In fact, the cost got rejected from the resistance zone. A market overview also shows that this pattern will continue to surge in the coming trading days.
Resistance Level: $11- $12.0
Support Level: $8.0- $8.50


