

- The AXS token price sustains above the 55-EMA’s during intraday.
- The 24-hour trading volume is at $507 million.
- AXS/BTC pair is trading positive by 8.2% at 0.00228967 BTC.
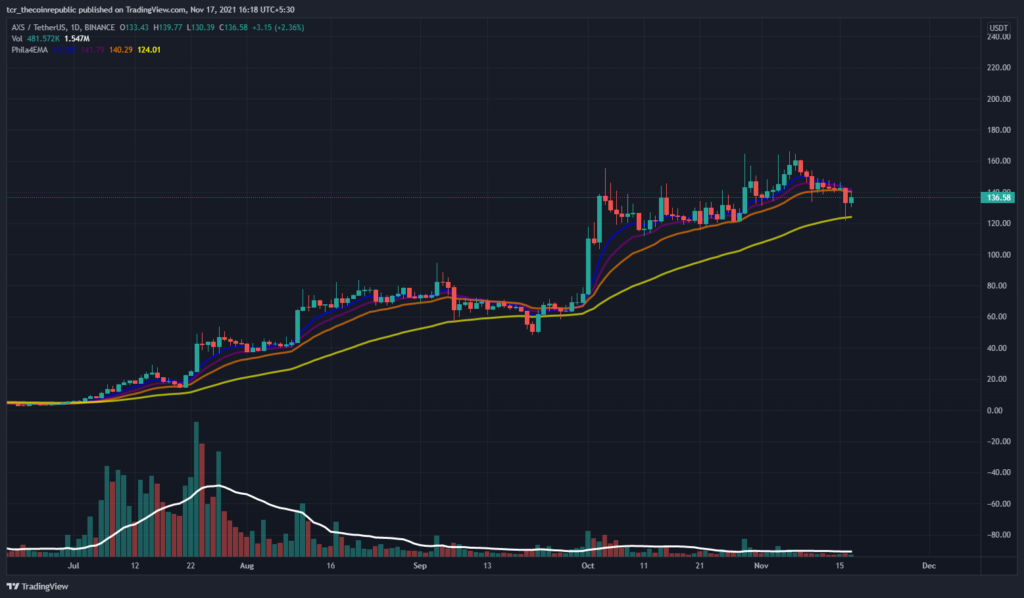
Moving Average (EMA) In the AXS token daily price chart containing 8,13,21,55 EMA, it is reliable support for currency price movements. Investors can find that price moves above the yellow line and guarantee uptrend as long as prices are above the moving average.
The volume (500.808 K) is below the 20-day moving average (1.548 M). The volume is low, so the cost has decreased a bit. Investors may also mark a decrease in volume. This indicates that unusual changes are normal on the following trading days.


AXS Token Price Accumulates Below Resistance Level
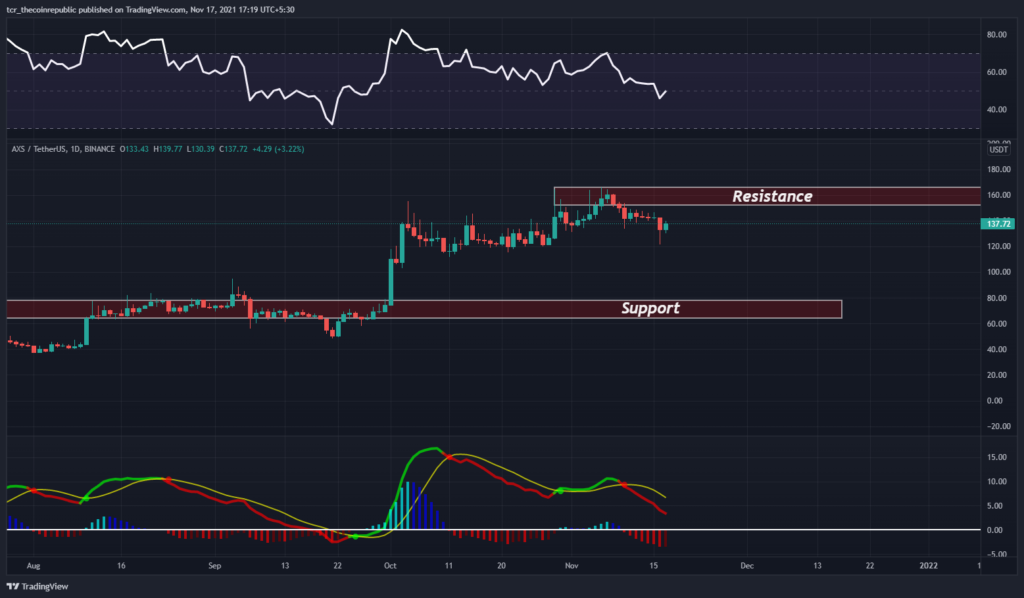
The daily price chart of AXS token moves towards the resistance zone. Depending on the price action, the support area is within $60- $80. On the flip side, the resistance range to look for is around $160.
The RSI showed a signal of 49.50 (bullish) with a short-term buy sign. Investors may find that the indicator’s RSI line is running upside. A surge can happen on future trading days.
The MACD shows a (bearish) cross below the signal line on November 10, indicating a sell signal for the currency. In addition, investors can see red bars in the histogram indicator.
Conclusion
Axie Infinity price today is $138.09 with a 24-hour trading volume of $496,370,193. AXS price is up 6.4% in the last 24 hours. It has a circulating supply of 66 Million AXS coins and a total supply of 270 Million.
RSI shows buy and MACD indicate a sell signal. Traders have directed low volume. In fact, the cost is testing the resistance zone. A market overview also shows that this pattern will continue to surge in the coming trading days.
Resistance Level: $160
Support Level: $60 – $80


